

As network engineers, we’re stuck between the high-level monitoring dashboards and those deep packet capture tools. When something starts going wrong on a host, the first thing we want to do is fire up netstat or ss. However, both of those utilities just give us a snapshot. We then go for the “big guns” such as Wireshark or tcpdump, which are fantastic tools but are too heavy. And even then, they don’t really tell us which process is using which connection.
RustNet (https://github.com/domcyrus/rustnet) fills that gap nicely.
RustNet is an open-source tool built in Rust that provides real-time network traffic analysis. It does it all from a Terminal User Interface (TUI): live connection state tracking, per-connection bandwidth, process attribution, Deep Packet Inspection (DPI) and TCP health analytics. All these utilities in one single binary that will run just fine over SSH.
Why RustNet Stands Out
RustNet’s own README does a great job of explaining its design philosophy. It’s supposed to sit between connection tools like netstat and ss, and full-on packet analyzers like Wireshark and tcpdump. As an open source network analysis tool, it’s true usefulness for network engineers lies in these three features:
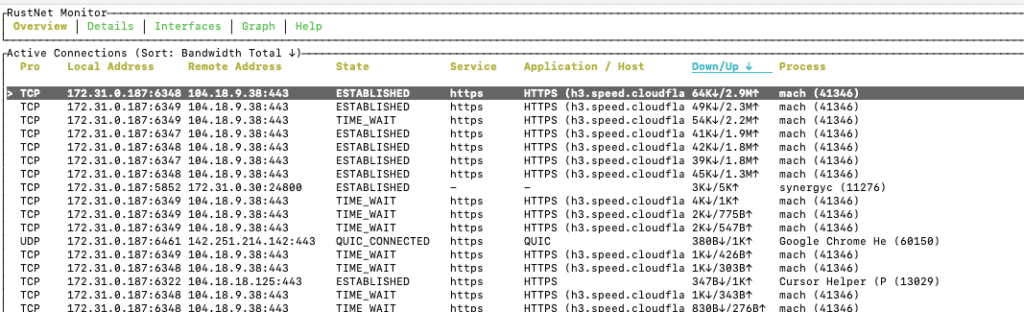
Process attribution. So every single active connection is mapped to the owning process and PID. Wireshark sees packets, not sockets, so it can’t tell you which process is using which connection. With RustNet you can see that the connection to 104.18.9.38:443 is actually owned by the mach process (PID 41346), as shown below.
SSH-friendly TUI. The terminal interface will happily work over any SSH session without needing any X11 forwarding or GUI dependencies. That makes it a real game-changer for remote troubleshooting on servers, cloud VMs, or Raspberry Pis.
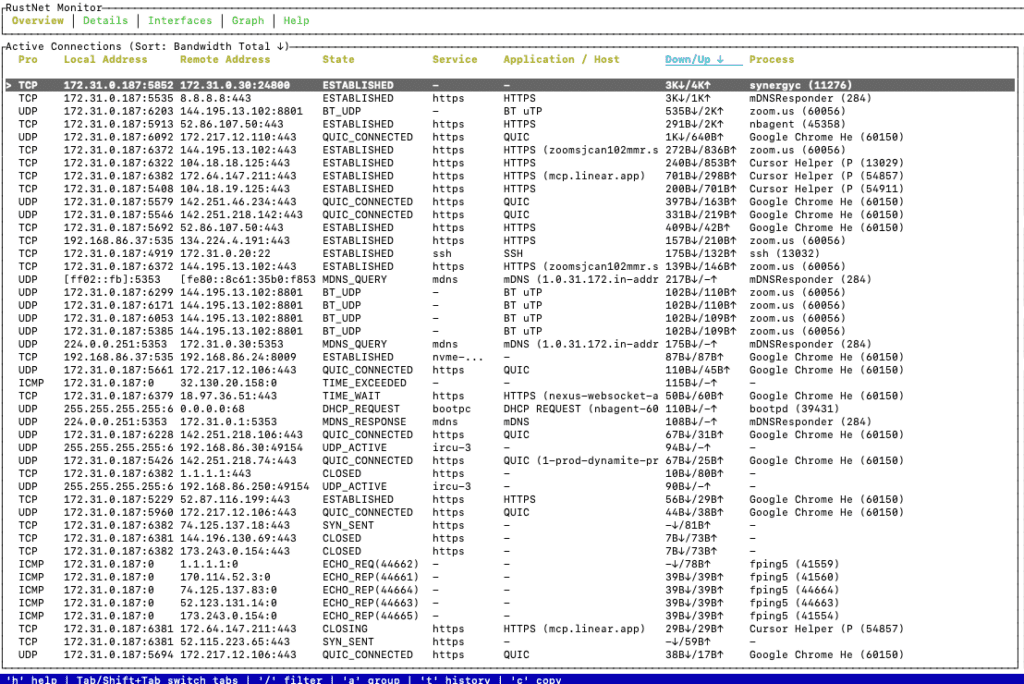
Deep Packet Inspection. RustNet will identify application layer protocols (HTTP, HTTPS/TLS with SNI hostname extraction, DNS, SSH, QUIC, DHCP, mDNS, SNMP and more) and display that all inline. You can instantly tell whether a connection is using QUIC or TCP. Alternatively, if there’s a high-bandwidth UDP stream that’s actually BitTorrent over BT uTP.
How It Compares to Sniffnet
If you read our earlier post on Sniffnet, a cross-platform network monitoring tool that makes traffic analysis easy to understand, you’ll know that it’s a fantastic tool for getting a quick, high-level view of what’s flowing in and out of your network interfaces. It breaks down network traffic by protocol, country and application. It makes traffic analysis accessible to everyone with its nice GUI and intuitive charts.
RustNet and Sniffnet share the same goal of being cross-platform and of making network traffic understandable at a glance, but they approach things in different ways.
Firstly, RustNet is a TUI rather than a GUI app, which makes it perfect for running over SSH on remote servers and headless devices – something we do all the time when troubleshooting infrastructure.
Secondly, where Sniffnet is all about classifying and looking at flows, RustNet is all about individual connections – every row in the table is a live socket, with per-connection bandwidth, TCP state, SNI hostname and all that jazz.
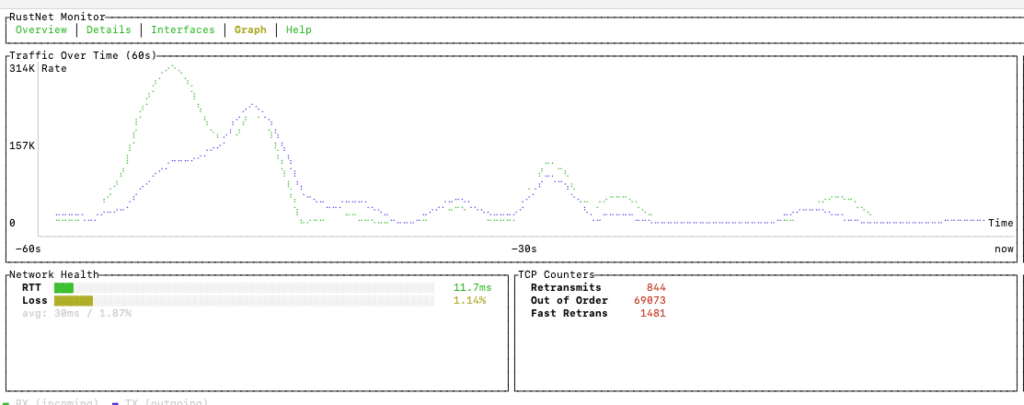
Thirdly, where Sniffnet only gives us aggregate traffic stats, RustNet exposes the actual TCP health counters, such as retransmissions, out-of-order packets, and fast retransmits. We need this information to diagnose actual performance problems, not just observe traffic patterns.
The two tools are genuinely complementary. Sniffnet is the way to go if you just want a fast, quick view of what’s going on on a machine. RustNet is better for pinpointing which process is using a dodgy connection and how healthy its transport layer is.
Which Platforms Are Supported
RustNet is genuinely cross-platform, with support for:
- Linux (our main platform, with eBPF-enhanced process ID on kernel 5.13 and above)
- macOS
- Windows (you need Npcap with WinPcap API-compatible mode enabled)
- FreeBSD (we have a separate release page for that)
- Docker (we have an official container image up and running)
On Linux, RustNet uses eBPF by default for low-overhead process IDing. A known limitation is that eBPF’s comm field is limited to 16 characters, so multi-threaded apps like Firefox or Chrome will show thread names instead of the main process name. RustNet will automatically fall back to procfs-based IDing if eBPF is unavailable.
Installation is a breeze across all major platforms. You can find the latest installation instructions for each platform at the official GitHub repo and its INSTALL.md.
3 Common Use Cases for Network Engineers
1. Identifying Top Talkers and Bandwidth Hogs
One of the things you can do right away with RustNet is figuring out which processes or network connections are hogging the most bandwidth on your host. The Overview tab gives you a list of all the active connections, sorted by how much bandwidth they’re using in real time.
If you sort by “Down/Up” you’ll get straight to the top bandwidth consumers. This is super useful on shared servers or agents where you might have unexpected background processes competing for bandwidth with production traffic.
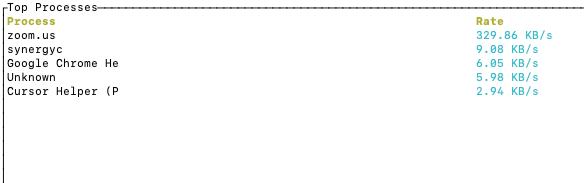
You can also get an explicit view of the top processes in terms of bandwith rates:
2. Real-Time TCP Health Analysis During a Speed Test or High-Throughput Event
The Graph tab shows you a rolling view of your traffic rate, alongside some key TCP health metrics: RTT (round trip time), loss gauges, plus counters for retransmits, out-of-order packets and fast retransmits.
In the screenshot above you can see RustNet in action during a cloudflare speed test using mach. Every connection to cloudflare’s infrastructure gets attributed to the correct process, and the per-stream breakdown shows how the speedtest is handling its HTTP/3 streams.
3. Application-Layer Visibility During Video Conferencing Troubleshooting
When someone comes to you with a video call issue, you might first check CPU, ping latency and general bandwidth. But with RustNet, you can drill down even further to see exactly what Zoom is up to at the transport layer.
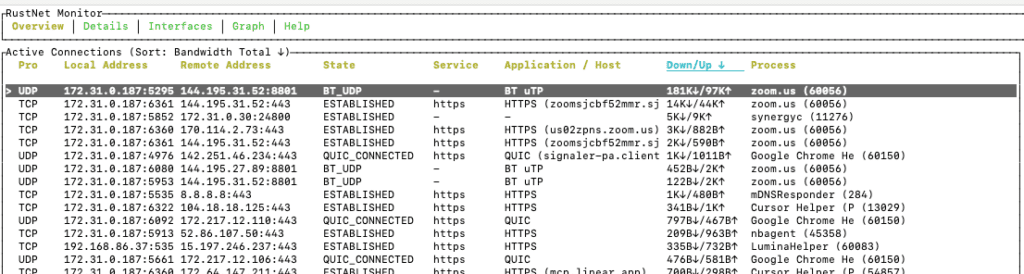
In the screenshot above, we’re looking at a live Zoom session – RustNet identifies the mix of protocols: standard HTTPS for signalling, QUIC for media transport, and UDP for the peer-to-peer media relay. If that connection were to disappear or show high loss in the TCP counters, you’d know exactly where to look for the problem.
This level of visibility, process name + protocol + SNI + bandwidth per stream – really sets RustNet apart from tools that just give you a static snapshot of your traffic.
Final Thoughts
In short, RustNet is a really practical tool that every network engineer should have in their toolkit. It’s a great real-time network traffic analysis tool that’s part of the open-source ecosystem. And it’s got some serious capabilities when it comes to serving up the details of what is causing traffic issues on your host.
It doesn’t replace Wireshark when you need to go deep forensic. But RustNet is an excellent tool for real-time interaction, process-aware connection monitoring that runs over SSH with no gui required.