

Cue the confetti, our baby just turned 10! That’s right, our exclusive Google Ads benchmarks report has officially been your go-to source for the latest average metrics in search ads for 10 years straight.
To celebrate, we’re back and better than ever with more PPC data and insights for this year! We looked at over 13,000 search advertising campaigns across 23 industries running between April 2025 and March 2026 to bring you the freshest averages for four key metrics in Google Ads and Microsoft Ads—including click-through rate, cost per click, conversion rate, and cost per lead.
Plus, we’re sharing expert analysis and actionable tips to help you maximize your business’s search strategy with data-backed confidence.
You’ll also get a look back at the last 10 years of search ads benchmarks!
Let’s jump in before I get emotional. After all, I’ve been writing these benchmarks for the last five years; which is half the total years they’ve been alive and, like, 20% of the total years I’ve been alive (give or take😉).
Contents
🏃On the go? Take this data with you! Download our free 2026 Google Ads benchmarks report here.
Key search ads trends: The big picture
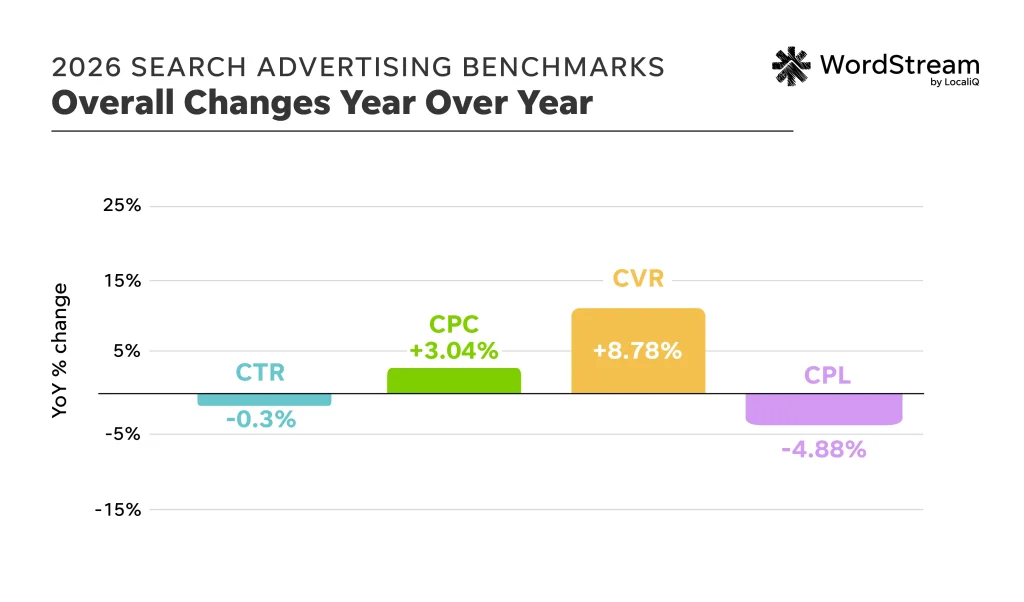
Overall, year-over-year results from 2025 to 2026 were fairly stable. The differences between the numbers are much more mellow compared to our 2025 and 2024 reports, where we saw significant fluctuations, including a 12% increase in CPC and 25% increase in CPL.
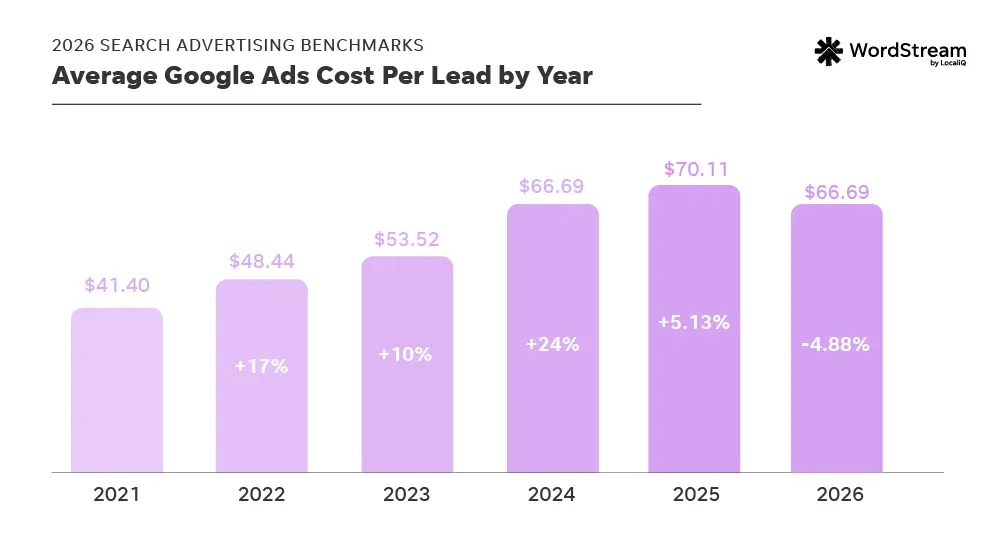
In fact, perhaps the biggest highlight from our latest benchmarks is that, for the first time in five years, overall average cost per lead in Google and Microsoft Ads has actually gone down.
Here are the key search ads takeaways and trends for 2026 based on our latest data analysis:
- Metrics overall are quite stable year over year. This is a welcome surprise after years of flux and steeply increasing prices!
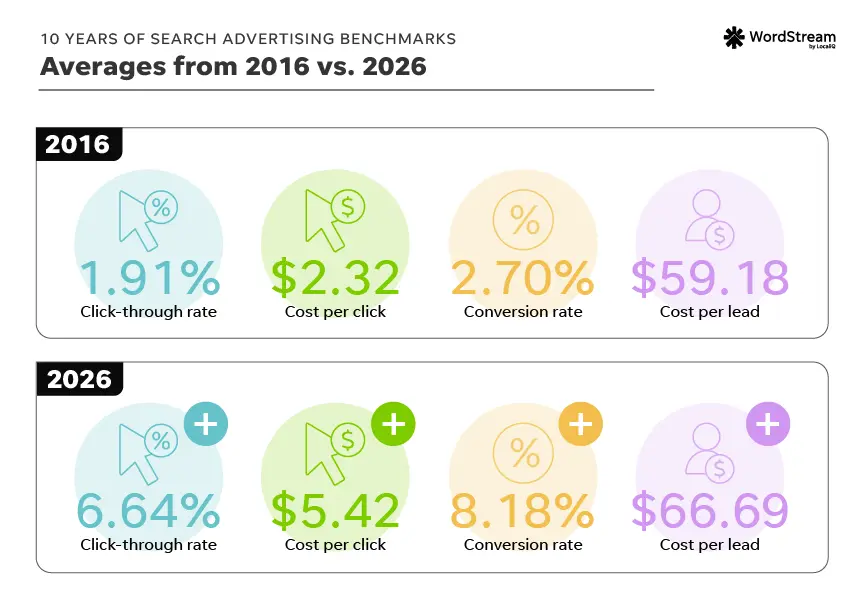
- That said, costs have gone up a LOT since we started these reports in 2016. CPC is over twice what it was 10 years ago ($2.32 versus $5.42), and CPL has increased by about 13%, with a $59.18 average in 2016 versus a $66.69 average in 2026. Factors such as inflation and competition have caused search ads costs to rise over time.
- In 2026, CPL went down for the first time in five years. This marks the first time we’ve measured a decrease in CPL since before 2020! The industries that did see increases in CPL aligned with those impacted by tariffs, including automotive and retail.
- Conversion rate increased for a whopping 87% of industries. This comes after a nice increase in CVR last year as well. Which is great news—with costs increasing, it’s heartening to know that the users engaging with ads are actually converting, making search ads a worthwhile investment for driving leads.
Over the last few years, we’ve seen a ton of new features, core updates, and more across Google’s platforms. The fact that average Google Ads metrics have mellowed a bit could indicate a more stable search landscape.
“Seeing an overall drop in cost per lead for the first time since before 2020 is a big signal that advertisers who’ve adapted to search platform changes are getting more stable and predictable results,” said Pepe Hernandez, a senior director of optimization strategy at LocaliQ.
Advertisers could be settling into a rhythm with a search environment that’s more automated by optimizing ads with AI Max and taking AI Overviews into consideration when planning campaigns.
“With campaign types like Performance Max and other AI-driven settings such as AI Max, it’s become a lot easier to generate leads at a lower cost,” said Brett McHale, Founder of Empiric Marketing.
⚡Want to optimize your Google Ads results fast? Start with a free, instant account report using our Google Ads Grader!
Microsoft and Google Ads benchmarks for every industry
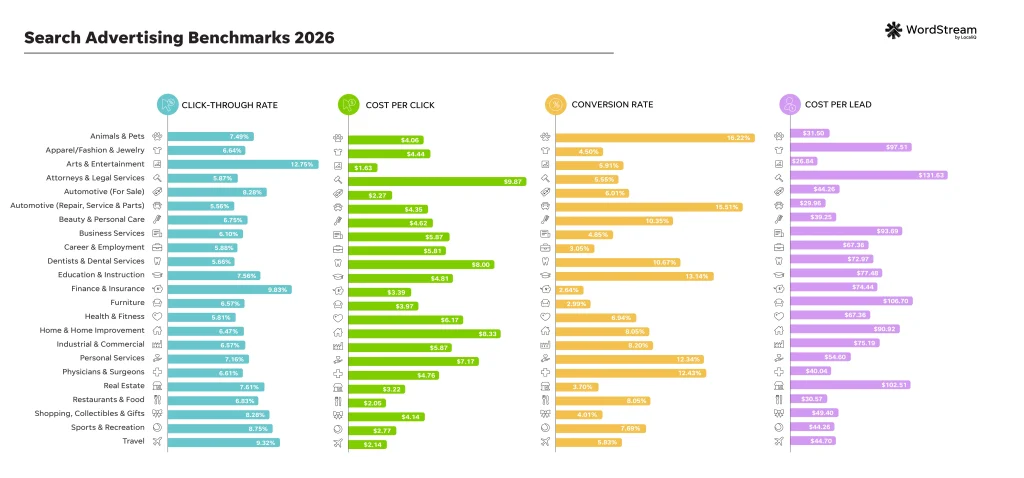
Check out the Microsoft and Google Ads benchmarks across all metrics and industries for 2026.
Click to enlarge
Average click-through rate
Driving clicks is your key to unlocking search ads success, as users need to click on your ads first before they can convert into customers.
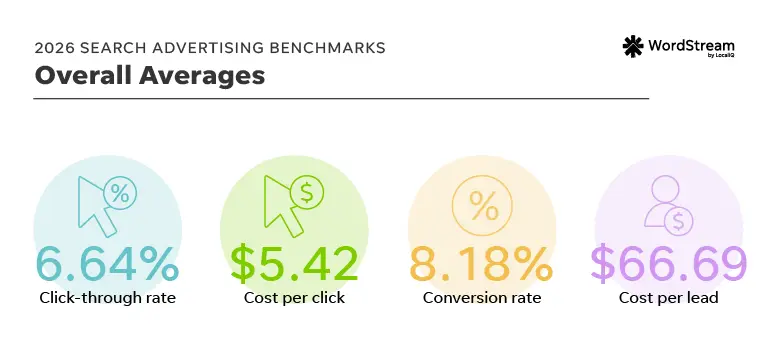
The average click-through rate in Google Ads in 2026 is 6.64%.
Click-through rate directly connects to your business’s bottom line, as higher-performing ads are more cost-efficient and resonate better with your audience. So, you want to maintain a high CTR across your search campaigns.
“Click-through rate is vital to assess the relatability and relevance of your ads to your target audience,” said Colby Flood, Founder of Brighter Click.
To improve CTR, start by looking at your ad copy and creative to ensure your ads are as enticing and relevant as possible—you could even have Google’s automated features, like AI Max for search campaigns, help you do this.
“Test out different ad copy styles, or let AI Max try, and see what shifts yield the right kind of clicks and conversions,” said Stephanie Scanlan, Vice President of Customer Success at LocaliQ.
“A shift in language can bring you more consumers ready to click on high-dollar products,” Stephanie said.
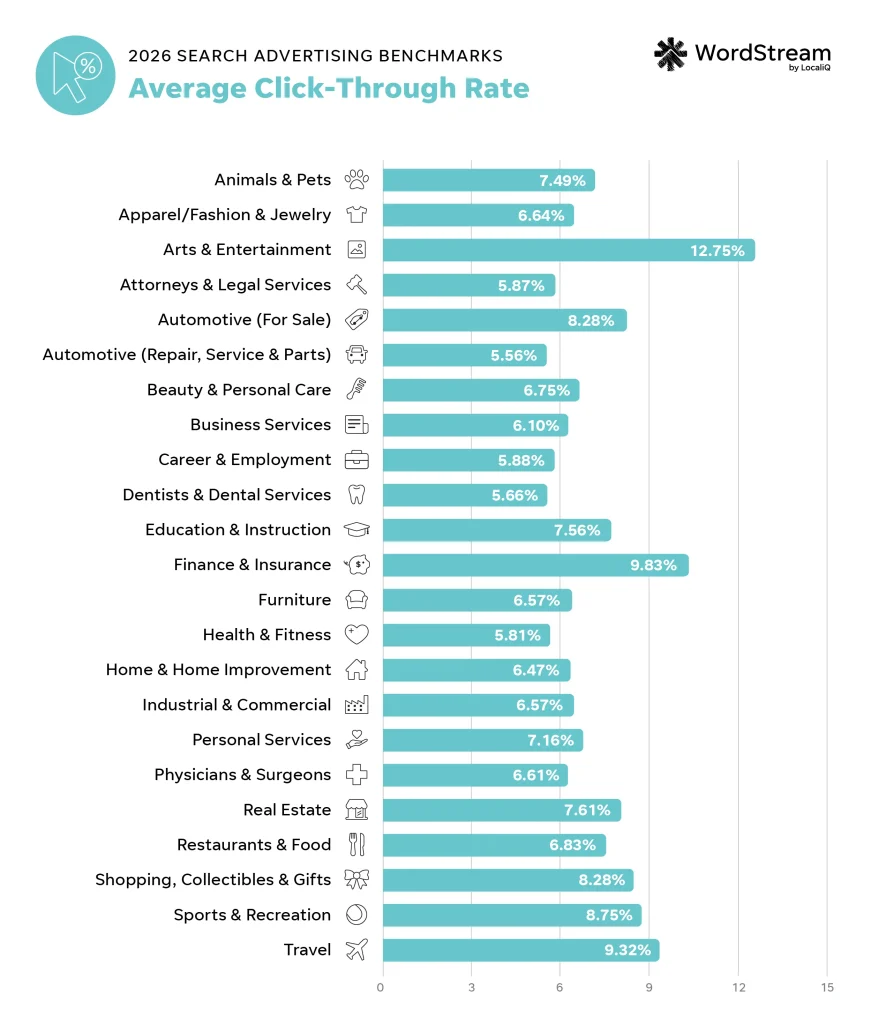
| Business category | Average CTR |
| Animals & Pets | 7.49% |
| Apparel / Fashion & Jewelry | 6.64% |
| Arts & Entertainment | 12.75% |
| Attorneys & Legal Services | 5.87% |
| Automotive — For Sale | 8.28% |
| Automotive — Repair, Service & Parts | 5.56% |
| Beauty & Personal Care | 6.75% |
| Business Services | 6.10% |
| Career & Employment | 5.88% |
| Dentists & Dental Services | 5.66% |
| Education & Instruction | 7.56% |
| Finance & Insurance | 9.83% |
| Furniture | 6.57% |
| Health & Fitness | 5.81% |
| Home & Home Improvement | 6.47% |
| Industrial & Commercial | 6.57% |
| Personal Services | 7.16% |
| Physicians & Surgeons | 6.61% |
| Real Estate | 7.61% |
| Restaurants & Food | 6.83% |
| Shopping, Collectibles & Gifts | 8.28% |
| Sports & Recreation | 8.75% |
| Travel | 9.32% |
The industry with the highest click-through rate was Arts and Entertainment, at 12.75%. This was followed by Finance and Insurance and Travel, at 9.83% and 9.82%, respectively.
The industry with the lowest click-through rate was Automotive—Repair, Service and Parts, at 5.56%. This was followed by Dentists and Dental Services and Health and Fitness, at 5.66% and 5.81% respectively.
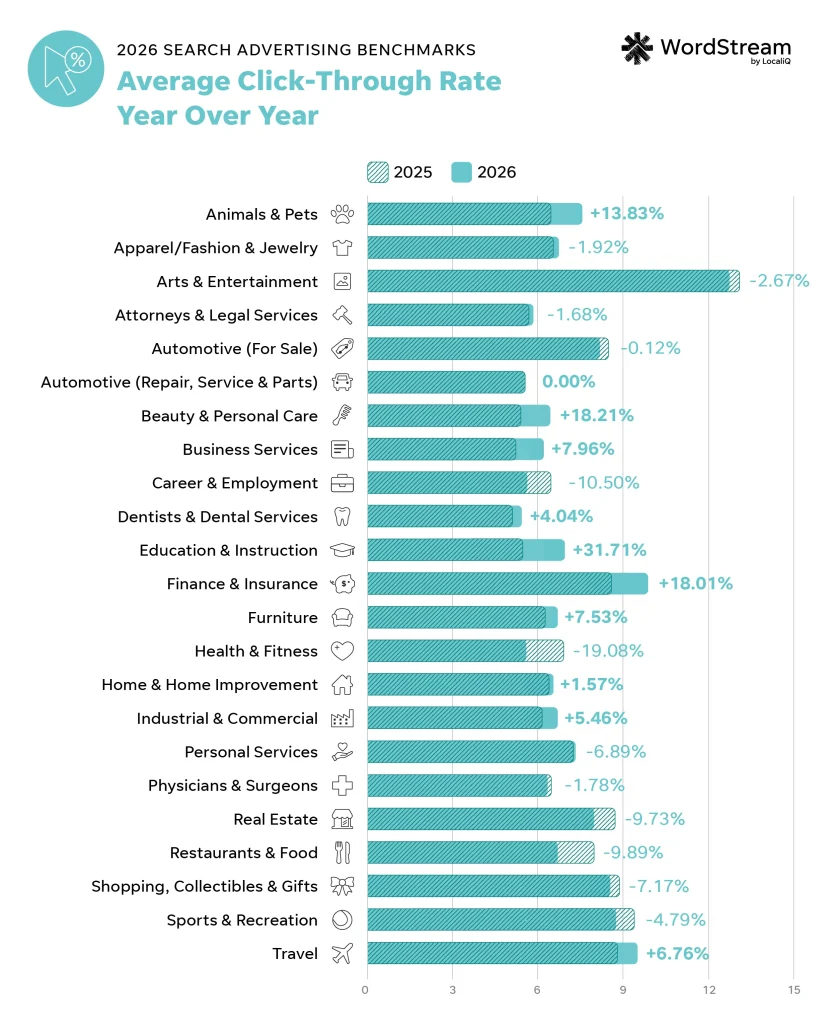
Average click-through rate: YoY
Our clients are seeing fairly stable CTRs year over year. This is in contrast to market trends, which show lower click-through rates not just for organic results but even for paid ads. We attribute this to optimization tech in the LocaliQ platform.
“Our clients are seeing greater improvements than the broader industry. This outperformance is driven by our platform’s focus on campaign optimization strategies such as Smart Bidding, AI Max, intent‑based keyword management, and visual‑first creative,” said Katie Ashafa, a senior director of optimization strategy at LocaliQ.
Industries that saw the biggest improvements in CTR year over year were Education and Instruction (up 31.71%), Beauty and Personal Care (up 18.21%), and Finance and Insurance (up 18.01%).
The industries that had the biggest drops in CTR performance year over year were Health and Fitness (down 19.08%), Career and Employment (down 10.50%), and Restaurants and Food (down 9.89%).
“Specific industries will continue to see ebbs and flows based on what is happening in the world. The increase in the Beauty and Personal Care category is expected as influencer culture on consumerism has reached an all-time high,” Stephanie said.
“Likewise, with economic concerns brewing in news reports, we’re seeing more people searching for finance or insurance help.”
Average cost per click
Cost per click is the first budget-related metric advertisers focus on when assessing campaign performance. You want to shoot for a super high click-through rate whenever you can, but also be mindful of how much you’re paying for clicks.
The average cost per click in Google Ads in 2026 is $5.42.
The whole point of pay per click advertising is to, well, pay for clicks! If you’re paying for every single one of the (hopefully) many, many clicks your ads bring in, you’ll want those clicks to run you the lowest price possible. This will stretch your Google Ads budget further—which is why maintaining a low cost per click is so important.
However, when you work to lower your cost per click by, say, culling costly keywords from your keyword lists, consider that a higher average CPC can be worth it if it’s getting you closer to your conversion goals. This is dependent on your business’s advertising objectives, of course, but it’s not crazy to keep higher CPC campaign assets running if they’re converting well.
“Focusing too much on cost per click can lead you to cheaper clicks that don’t convert. I pay close attention to conversion rate and cost per lead in relation to CPC,” said Cliff Sizemore, Senior Marketing Manager at LocaliQ.
Managing your cost per click is where it becomes very apparent how much of a balancing act PPC can be!
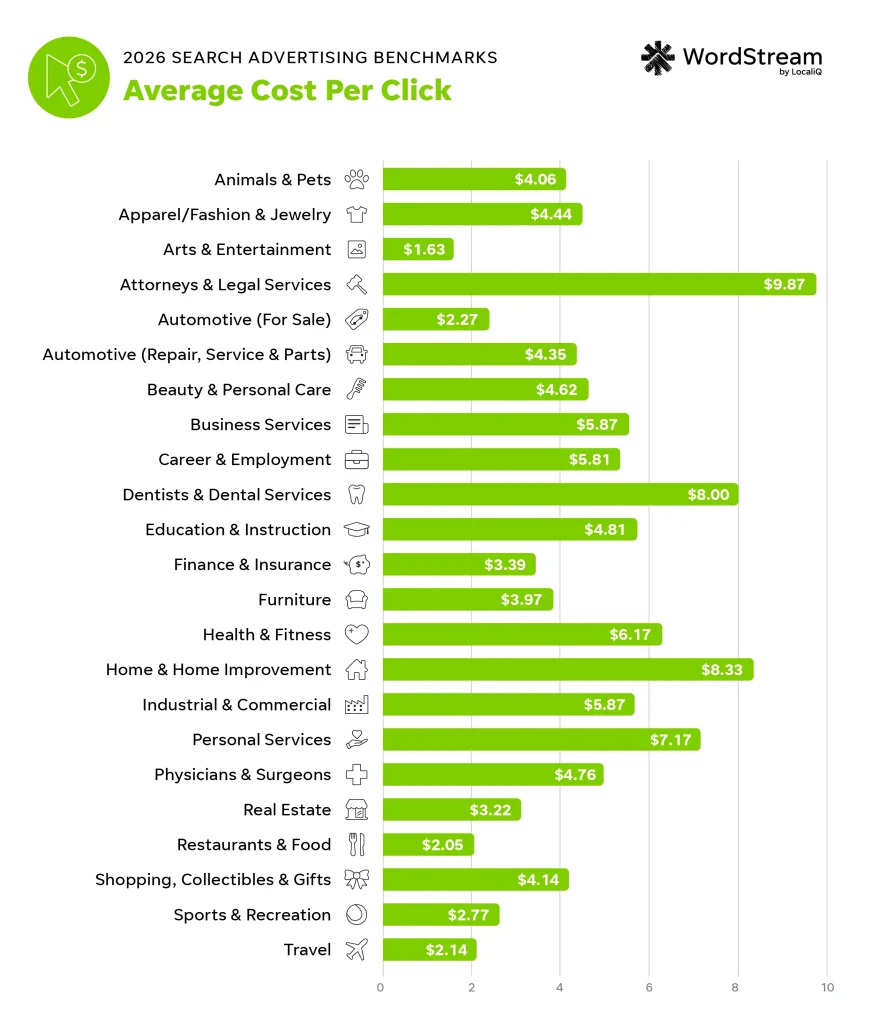
| Business Category | Average CPC |
| Animals & Pets | $4.06 |
| Apparel / Fashion & Jewelry | $4.44 |
| Arts & Entertainment | $1.63 |
| Attorneys & Legal Services | $9.87 |
| Automotive — For Sale | $2.27 |
| Automotive — Repair, Service & Parts | $4.35 |
| Beauty & Personal Care | $4.62 |
| Business Services | $5.87 |
| Career & Employment | $5.81 |
| Dentists & Dental Services | $8.00 |
| Education & Instruction | $4.81 |
| Finance & Insurance | $3.39 |
| Furniture | $3.97 |
| Health & Fitness | $6.17 |
| Home & Home Improvement | $8.33 |
| Industrial & Commercial | $5.87 |
| Personal Services | $7.17 |
| Physicians & Surgeons | $4.76 |
| Real Estate | $3.22 |
| Restaurants & Food | $2.05 |
| Shopping, Collectibles & Gifts | $4.14 |
| Sports & Recreation | $2.77 |
| Travel | $2.14 |
Industries with the lowest CPCs included Arts and Entertainment ($1.63), Restaurants and Food ($2.05), and Travel ($2.14).
Meanwhile, industries with the highest CPCs included Attorneys and Legal Services ($9.87), Home and Home Improvement ($8.33), and Dentists and Dental Services ($8.00).
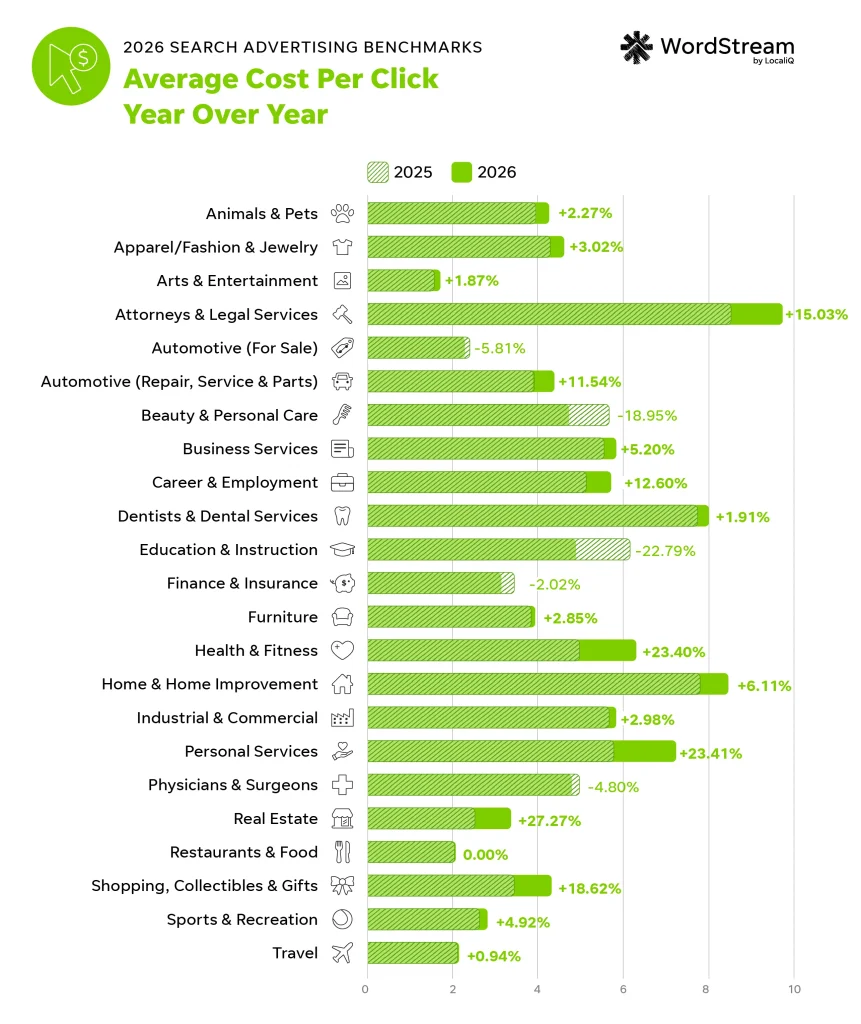
Average cost per click: YoY
Education and Instruction saw the biggest decrease in CPC in 2026—down 22.79%. Runner up was Beauty and Personal Care, which saw a 18.95% decrease in CPC, followed by Automotive — For Sale, with average CPC down 5.81% for that industry.
In contrast, Real Estate was the industry with the biggest year over year CPC increase, up 27.27%. Personal Services and Health and Fitness both had a CPC increase of about 23.41%.
Average conversion rate
Your average conversion rate is an indicator of how effective your business’s ads are at turning clicks into customers. You can track tons of different meaningful actions (on your site or offline) as conversion events in Google Ads and Microsoft Ads. A conversion rate tells you how frequently users who click on your ads complete those tracked actions.
The average conversion rate in Google Ads in 2026 is 8.18%.
This PPC metric is crucial for measuring the pace of leads moving through your sales funnel. Basically, a high conversion rate is something all accounts should strive for, since it indicates that your ads are working as intended.
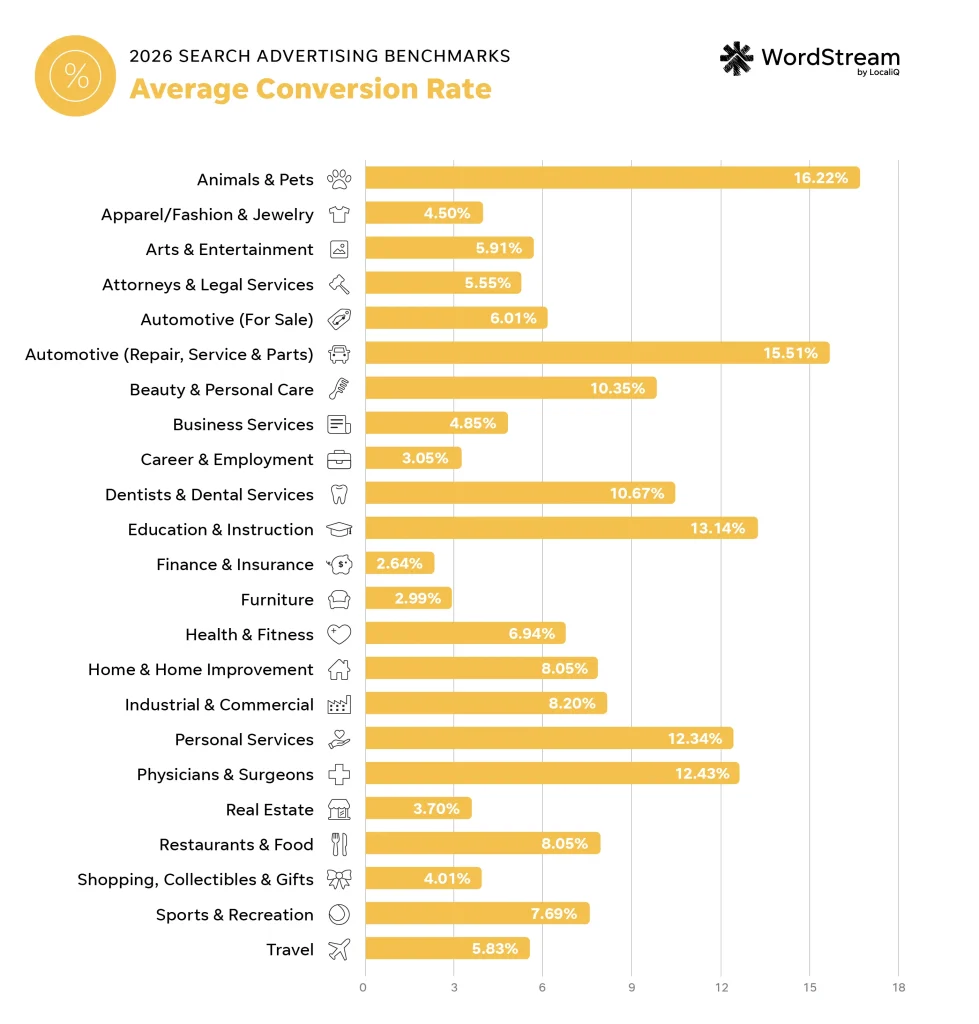
| Business category | Average CVR |
| Animals & Pets | 16.22% |
| Apparel / Fashion & Jewelry | 4.50% |
| Arts & Entertainment | 5.91% |
| Attorneys & Legal Services | 5.55% |
| Automotive — For Sale | 6.01% |
| Automotive — Repair, Service & Parts | 15.51% |
| Beauty & Personal Care | 10.35% |
| Business Services | 4.85% |
| Career & Employment | 3.05% |
| Dentists & Dental Services | 10.67% |
| Education & Instruction | 13.14% |
| Finance & Insurance | 2.64% |
| Furniture | 2.99% |
| Health & Fitness | 6.94% |
| Home & Home Improvement | 8.05% |
| Industrial & Commercial | 8.20% |
| Personal Services | 12.34% |
| Physicians & Surgeons | 12.43% |
| Real Estate | 3.70% |
| Restaurants & Food | 8.05% |
| Shopping, Collectibles & Gifts | 4.01% |
| Sports & Recreation | 7.69% |
| Travel | 5.83% |
Animals and Pets (16.22%), Automotive—Repair, Service, and Parts (15.51%), and Education and Instruction (13.14%) were the three industries with the highest CVRs.
Finance and Insurance (2.64%), Furniture (2.99%), and Career and Employment (3.05%) were the three industries with the lowest CVRs.
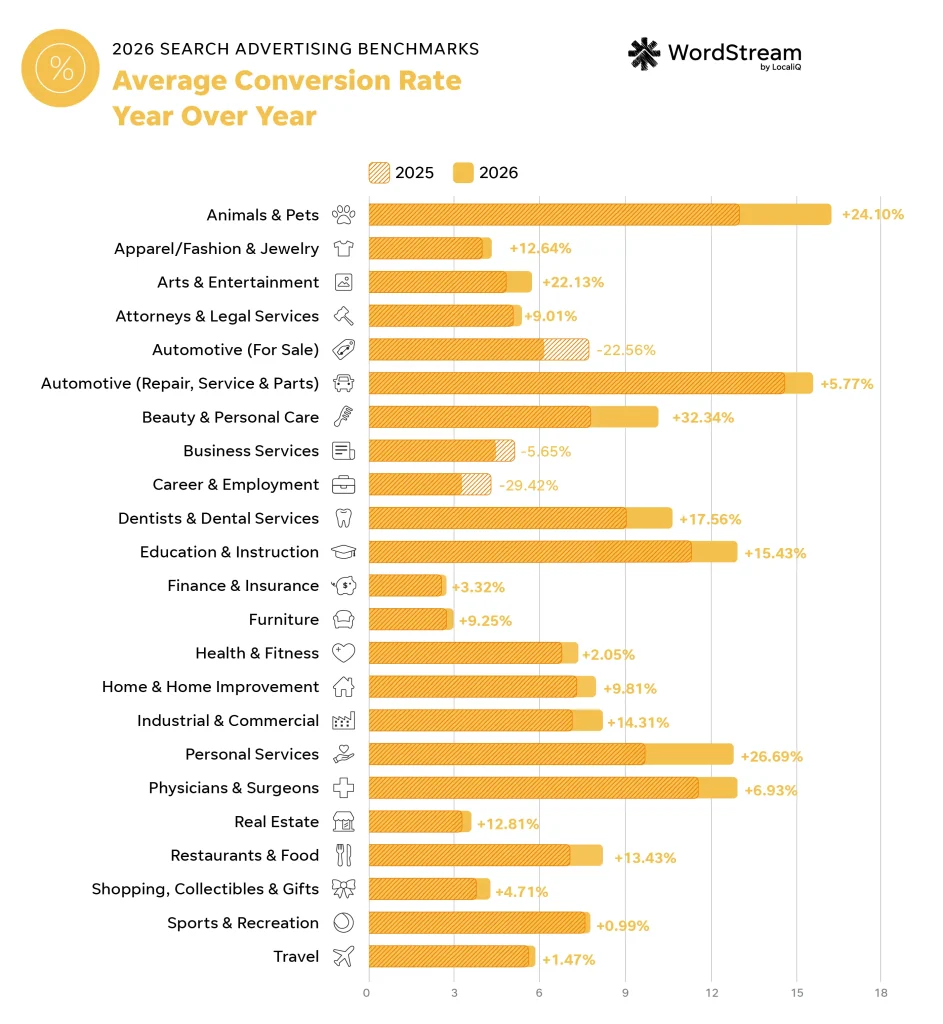
Average conversion rate: YoY
One of the industries with the lowest overall average CVR this year also saw the biggest decreases in CVR compared to 2025. Career and Employment CVR dropped by 29.42%. This industry was followed by Automotive—For Sale, which saw a CVR decrease of 22.56%, as well as Business Services, with its CVR down 5.65%.
Beauty and Personal Care saw the biggest year-over-year CVR increase, up 32.34%. Followed by Personal Services (up 26.69%) and Animals and Pets (up 24.10%).
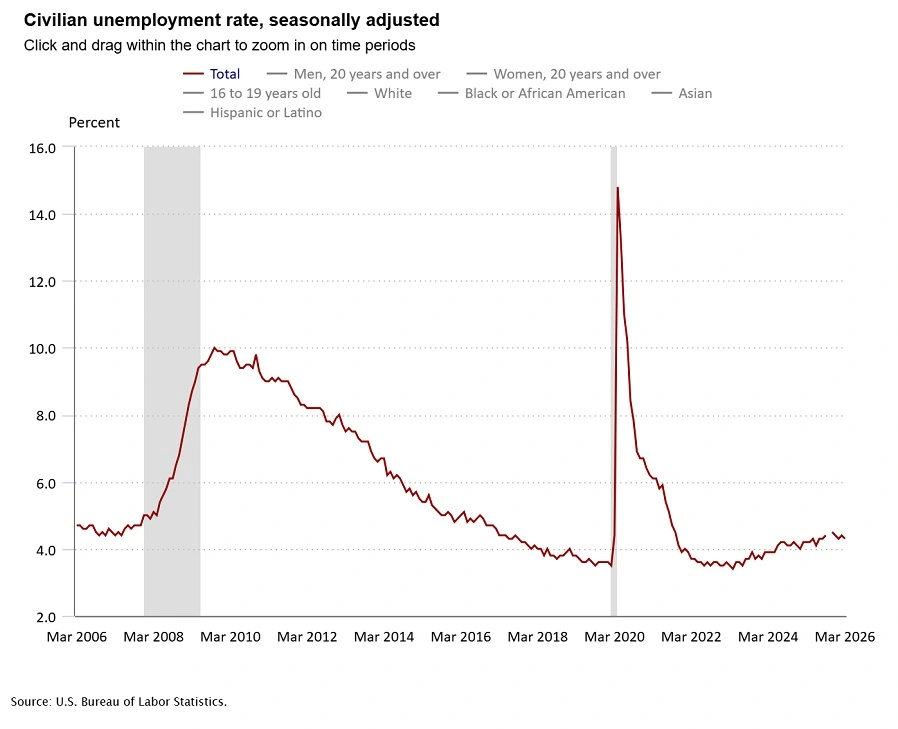
This is the second year in a row Career and Employment has dropped year over year in terms of average conversion rate. Unemployment rates have slightly increased over the years compared to when our benchmarks first started, but an unstable job market doesn’t mean businesses in this industry should give up on advertising.
Career and Employment brands tend to face many advertising restrictions, so it can be easy for those taking advantage of the campaign and targeting types they can use to be positioned ahead of competitors that are quick to throw in the towel.
Average cost per lead
The “bread and butter” of any Google Ads performance report, and the metric businesses care about most, is cost per lead.
The average cost per lead in Google Ads in 2026 is $66.69.
I first started coining the cost per lead as the “money metric” for search ads back in our 2023 benchmarks report, and I still stand on that. Cost per lead links your ad performance back to your business’s bottom line, as a measure of how much it costs to acquire a conversion from your ads. In other words, your cost per lead tells you if you’re getting the most “bang for your buck” with search ads.
“Cost per lead is an important in-platform metric for measuring paid search success. But it’s even more important to track search leads to the down-funnel pipeline and revenue. High lead volume means nothing if those leads aren’t converting into revenue,” said Kevin McClary, Head of Performance Marketing at Gorilla 76.
Cost per lead is just one of many metrics that tell a complete story about your campaign performance. You want to squeeze the most out of your ads with the least amount of spend, but in many industries, advertisers can run campaigns with a high cost per lead and still turn a profit.
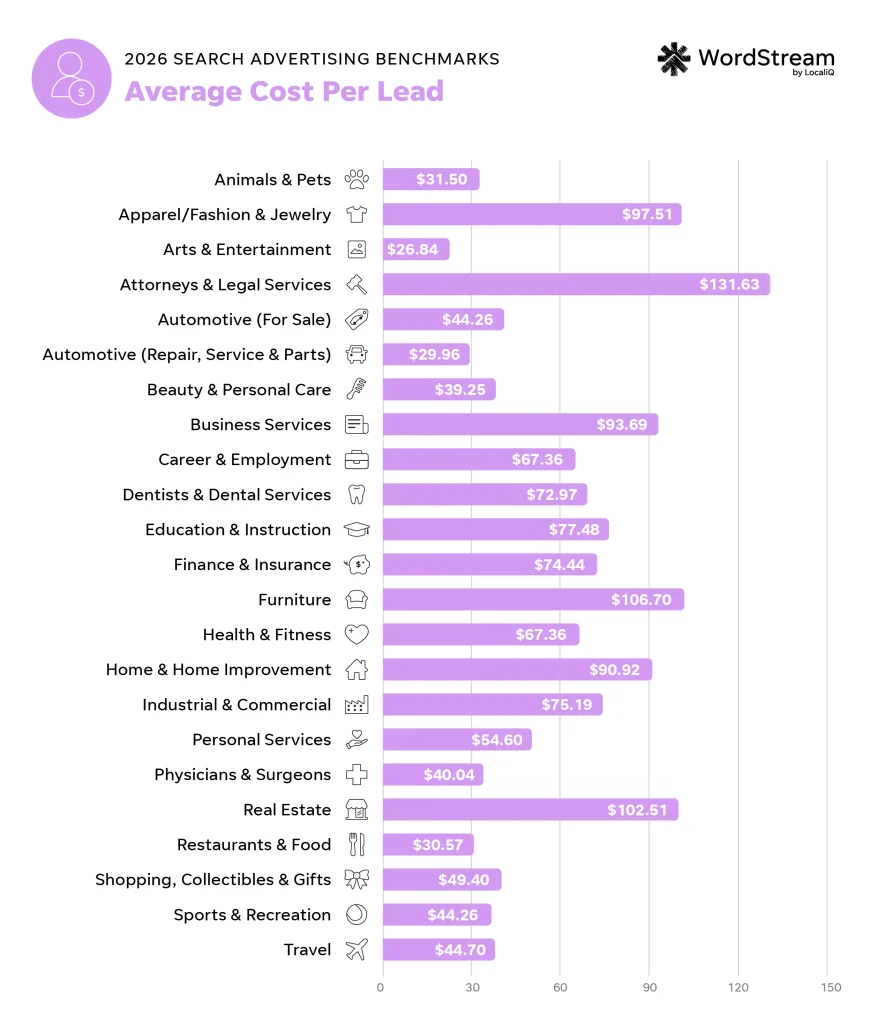
| Business category | Average CPL |
| Animals & Pets | $31.50 |
| Apparel / Fashion & Jewelry | $97.51 |
| Arts & Entertainment | $26.84 |
| Attorneys & Legal Services | $131.63 |
| Automotive — For Sale | $44.26 |
| Automotive — Repair, Service & Parts | $29.96 |
| Beauty & Personal Care | $39.25 |
| Business Services | $93.69 |
| Career & Employment | $67.36 |
| Dentists & Dental Services | $72.97 |
| Education & Instruction | $77.48 |
| Finance & Insurance | $74.44 |
| Furniture | $106.70 |
| Health & Fitness | $67.36 |
| Home & Home Improvement | $90.92 |
| Industrial & Commercial | $75.19 |
| Personal Services | $54.60 |
| Physicians & Surgeons | $40.04 |
| Real Estate | $102.51 |
| Restaurants & Food | $30.57 |
| Shopping, Collectibles & Gifts | $49.40 |
| Sports & Recreation | $44.26 |
| Travel | $44.70 |
The industry with the lowest cost per lead in Google and Microsoft Ads in 2026 is Arts and Entertainment at $26.84. This is followed by Automotive—Repair, Service & Parts, at $29.96, and Restaurants and Food, at $30.57.
On the opposite end, the industry with the highest cost per lead in Google and Microsoft Ads in 2026 is Attorneys and Legal Services, at $131.63. This is followed by Furniture, at $106.70, and Real Estate at $102.51.
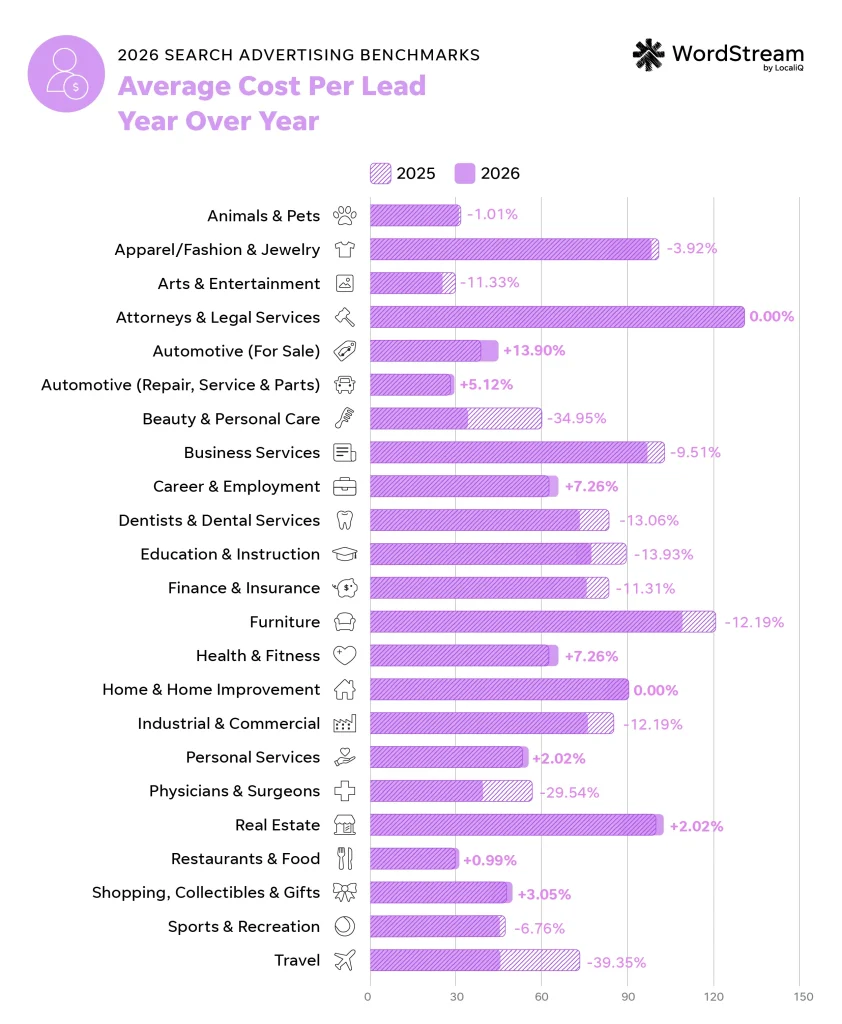
Average cost per lead: YoY
Industries that saw the highest year over year increases in cost per lead included Automotive—For Sale (up 13.90%), Health and Fitness as well as Career and Employment (both up 7.26%), and Automotive—Repair, Service, and Parts (up 5.12%).
In contrast, industries with the biggest year over year decreases in cost per lead were Travel (down 39.35%), Beauty and Personal Care (down 34.95%), and Physicians and Surgeons (down 29.54%).
What this data tells us about how to improve your own Google Ads performance
You’ve got the latest data, you’ve got context on how results in the search landscape have evolved, and now, you’re ready to apply everything to your strategy. Here’s everything you need to know to tackle your search ad campaigns in 2026 based on our findings.
1. Prioritize which search ads metrics you measure based on your goals
Our search ads solutions for our customers analyze much more than just the four metrics we’ve consistently covered in these benchmark reports. We’ve kept our search ads benchmarks focused on CTR, CPC, CVR, and CPL because they’re core metrics that provide a strong high-level view of campaign performance.
However, there are a ton more key performance indicators advertisers can, and should, consider when analyzing their accounts.
To accurately measure and optimize your search ads results, you’ll want to prioritize your metrics based on your unique business needs and goals. That way, you’re considering data points that matter most when making adjustments in your account.
“I usually tell people to try not to over-focus on any one metric. For example, CTR and CPC can look good on paper, but they don’t mean much if traffic isn’t converting. Especially in niche or lower-volume spaces, efficiency might matter more than volume,” said Varun Penatsa, Senior Digital Marketing Manager, Demand Gen, at Freshpaint.
Try playing around with the reporting capabilities within the Google Ads and Microsoft Ads platforms to see what additional metrics you could be sleeping on that could easily get pulled into a custom report.
“We encourage clients to evaluate the effectiveness of their entire paid ad strategy, rather than over‑indexing on individual, top‑of‑funnel metrics,” Katie said. “For example, if click-through rate declines but the clicks driven are higher quality and convert at stronger rates, that lower CTR alone does not warrant concern,” Katie said.
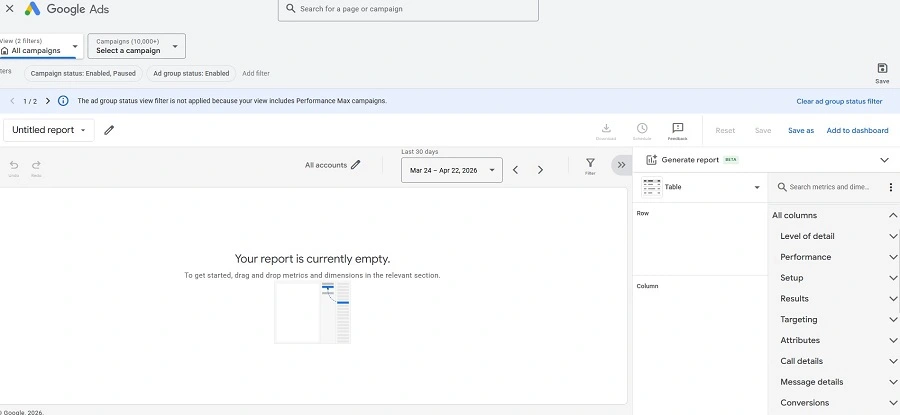
Google Ads reporting has improved exponentially since 2016, so tailor your view to the metrics that give you the best insight into your business’s bottom line!
2. Don’t be afraid to make regular changes in your account
Many small business advertisers have been running search ads for a few years now. It can be easy to hit cruise control once you feel confident in your account structure, but you’ll still want to regularly monitor and optimize your account. The data we’ve collected over the last 10 years puts into perspective just how much the search ad landscape can change from year to year, so don’t be surprised if your strategies from years prior are no longer effective.
Just be sure to allot time for a consistent account health check and be ready to pivot as needed. There’s nothing wrong with flexing your approach to search ads according to factors like the current economy, audience trends, and more.
Most PPC campaign changes take 30 days to stick, so it’s recommended to audit your campaigns monthly at a minimum.
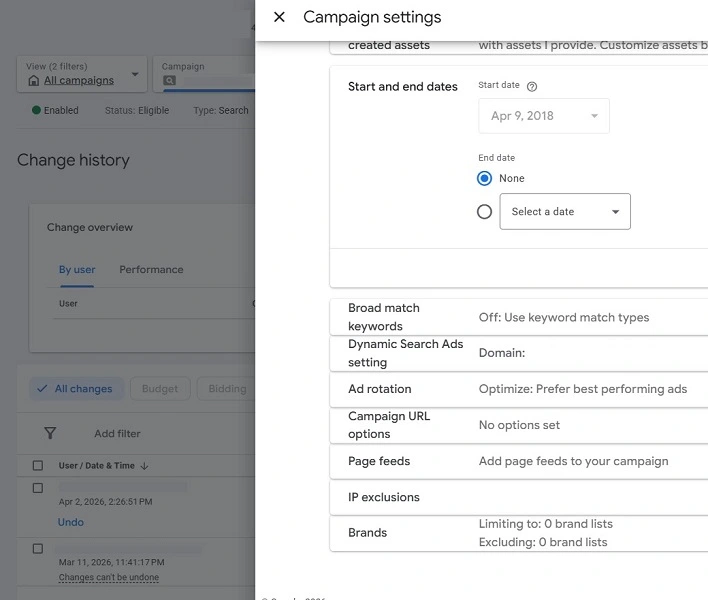
This example small business campaign has been running since 2018, but it still has changes recorded as recent as last month.
3. Supplement your search ads campaigns with automated features
Automation is the name of the game in Google Ads in 2026. For instance, Performance Max and Demand Gen campaigns both allow your ads to appear within the Google Ads search environment in addition to other placements. In other words, these campaigns give you more visibility for the same amount of effort. Try incorporating these fully automated campaign types into your account to balance your manually controlled search campaigns.
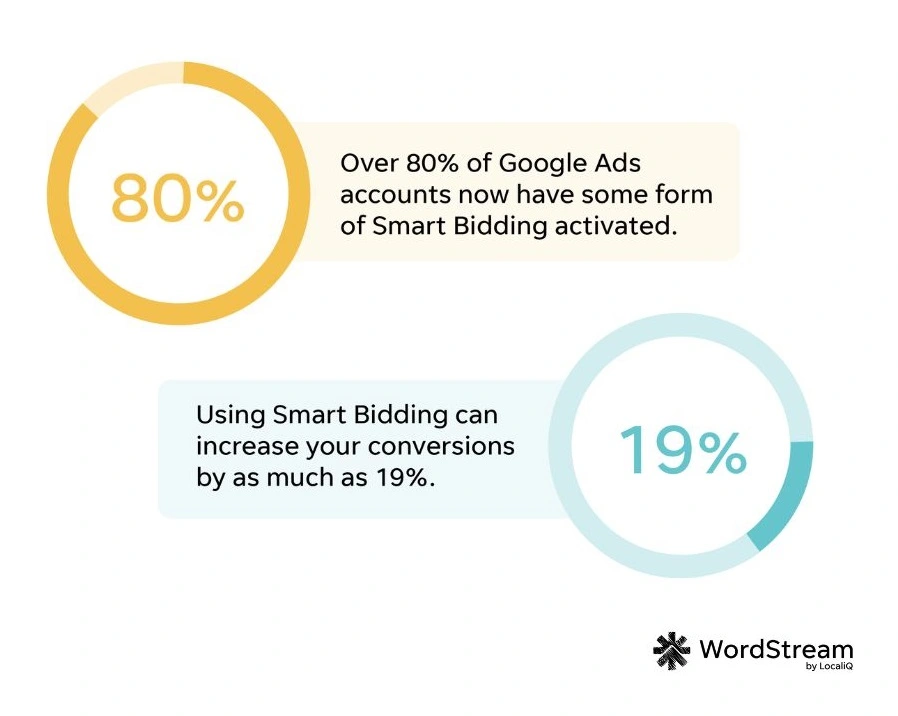
Also, you may want to expand your standard search campaign capabilities with automated features such as AI Max and Smart Bidding. AI Max can help your ads reach valuable, meaningful SERPs beyond what you’ve set up to target. Additionally, Smart Bidding is a go-to strategy for most advertisers looking to maximize their bids and budgets.
“Many accounts now lean on features like PMax and AI Max, which make it easier for the advertiser to take advantage of AI,” said Navah Hopkins, Ad Product Liaison at Microsoft.
“AI-powered ad campaigns tend to have higher conversion and relevancy rates. With automation, while there might be fewer clicks to the site directly from a standard search campaign, business is still happening at a profit,” Navah said.
4. Nail down your account basics
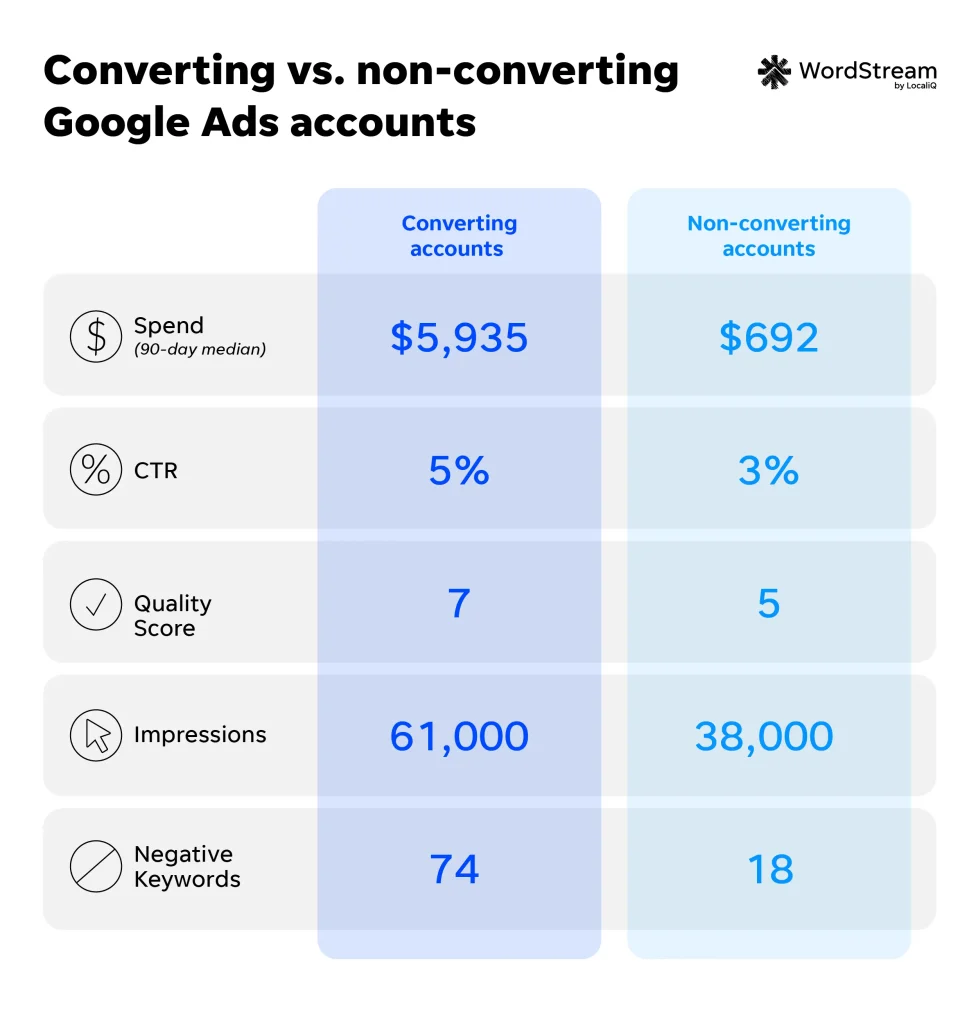
Many advertisers end up with results that fall behind the average performance in their industry because they let account basics slip. We recently analyzed over 15,000 Google Ads accounts and found that the foundational parts of campaigns have a huge impact on performance.
“Despite how much AI is involved in targeting and optimization now, the fundamentals haven’t changed when it comes to improving conversion rates over time,” Brett said.
In fact, adding just one negative keyword to your search or campaigns can triple your conversion rates.
The most effective accounts nail down their structure and focus on fundamentals like CTR and Quality Score to drive strong Google Ads results.
“Platforms are rewarding tighter alignment between keywords, ads, and landing pages,” Pepe said.
💪 Is your account’s foundation rock solid? Find out, and get tips to strengthen your strategy, with our free guide to the perfect Google Ads account structure!
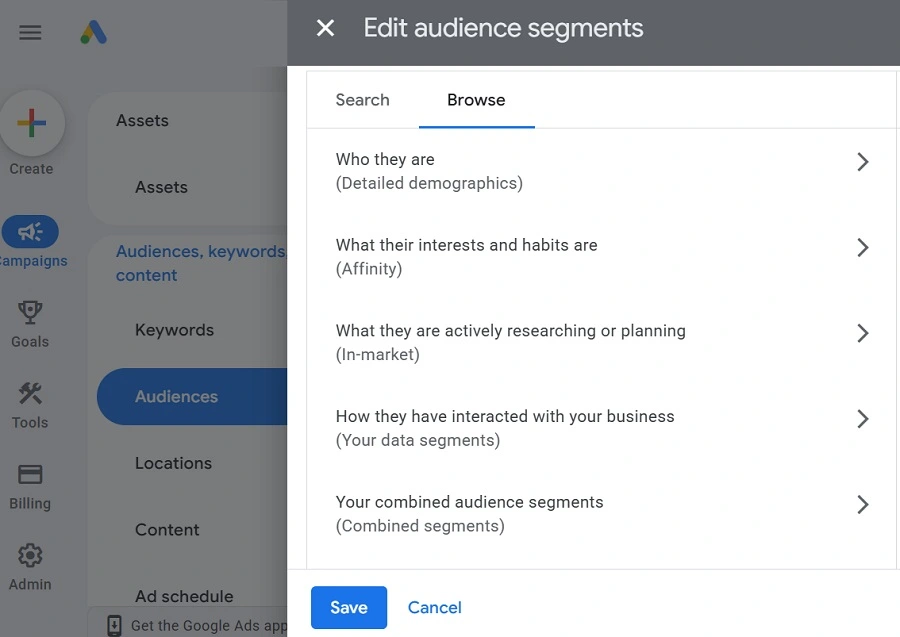
5. Get more granular with your targeting optimizations
In PPC, it’s all about quality over quantity when it comes to clicks and leads. To keep up with the pace in your industry, you’ll want to put your efforts toward audiences that are more likely to turn into customers.
“Being more intentional about your target audience, content on your landing pages, and thinking about the user journey can make a difference in your ability to drive a higher ROI,” said Katy Towe, a senior director of optimization strategy at LocaliQ.
Also, don’t let a high CPC keyword stop you from sourcing your best quality conversions.
“These benchmarks showcase that it isn’t about putting your ads and marketing efforts in front of all searches but the right searches,” Stephanie said.
“Our ability to optimize for conversion value demonstrates the growing need to tailor your campaigns to who your consumer is for your business. In recent years, it was about casting a wide net. Now, we can get much more granular on targeting with custom audiences, remarketing lists, interest and demographic lists, and lookalike audiences,” Stephanie said.
These types of optimized targeting lists ensure you’re showing ads to audiences better set out to convert. Plus, changes we’ve seen in the Google and Microsoft platforms emphasize putting your ads in front of more specific audiences.
“Advertisers should focus on showing their ads to a precise audience, with the right language, at the right time, and at the right cost,” Stephanie said.
6. Use data to inform your campaign optimizations
While you don’t want to constantly make changes within your Google Ads account, you do want to make regular optimizations to improve your campaigns. Try deploying different ad creatives, targeting, or bidding tests on a consistent basis to see what makes the biggest impact for your business.
“Get test ideas by asking yourself, ‘Do certain products or services yield a better conversion result at a certain time of the day or week? Have I crafted the right message for my ideal audience?’ Then take the data from the experiments to make decisions on the next steps and optimizations for you to make,” Stephanie said.
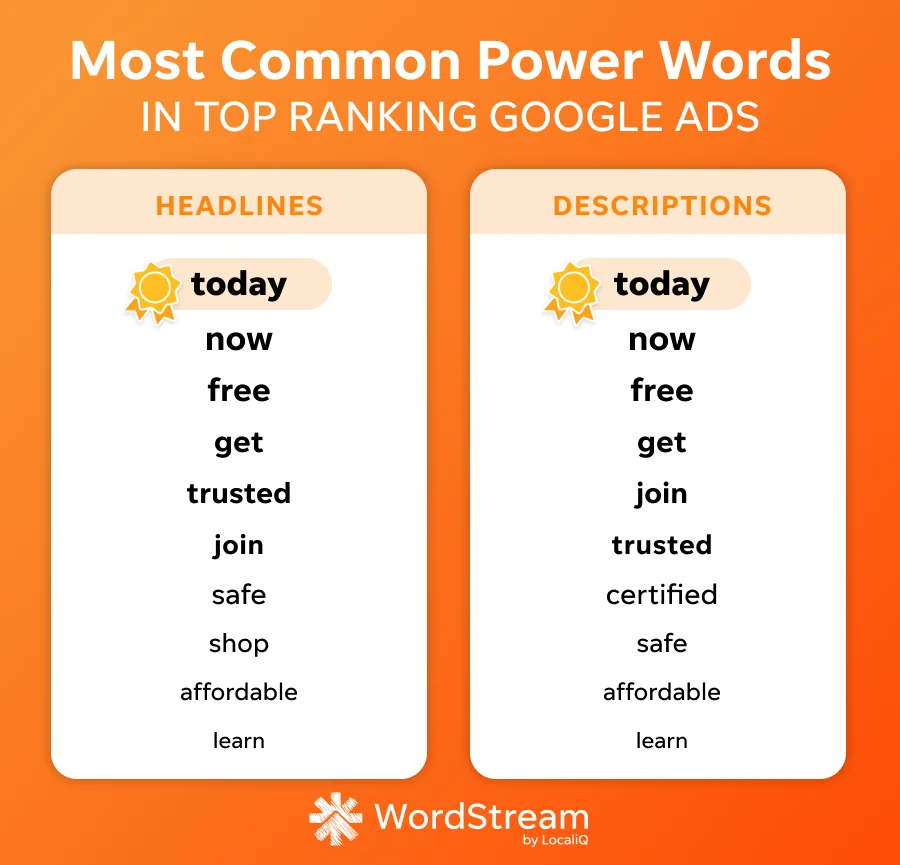
Try adding some power words from our study of top-performing Google Ads.
It’s also important to pull the right data so you can understand how your optimizations are contributing to campaign improvements.
“If you’re only tracking how many leads your campaign drove, you’re missing the point. You need to know which of those leads actually turned into customers, and that needs to feed into how you’re bidding—not just how you’re reporting,” said Katia Hausman, Vice President of Paid Media Products, LocaliQ
For example, with conversion value tracking, you can collect data on the worth of each action a potential customer takes after seeing your ad.
“The biggest standout here is the CPC and CVR increases coupled with a cost per lead decrease. This is especially important as platforms are shifting and brand and performance marketing converge. If there ever was a proof point to pivot to conversion value tracking, this is the proof point,” Navah said.
How Google Ads benchmarks changed over the years
Here at WordStream and LocaliQ, we believe in practicing what we preach. Many of our dedicated experts working with businesses that use our digital solutions reference these Google Ads benchmarks frequently when talking strategy—myself included when I was on our support team back in the day. The benchmarks have always been one of the most accurate ways to gauge an account’s performance.
“This report helps guide us to accomplish the client’s overall goal. We use trends and benchmarks to help us know if we are on the correct path to success, or if we need to pivot,” Pepe said.
Over the years, dozens of trusted industry publications have agreed that our benchmarks were the best resource for this use.
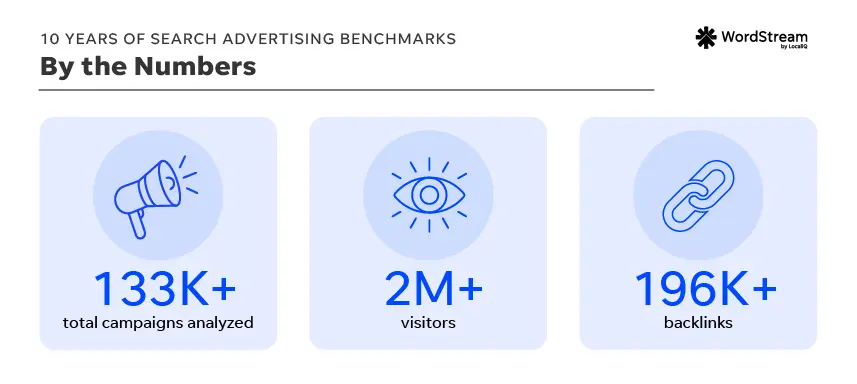
In fact, our benchmarks reports have yielded over 2 million total visits and more than 196,000 backlinks (so far).
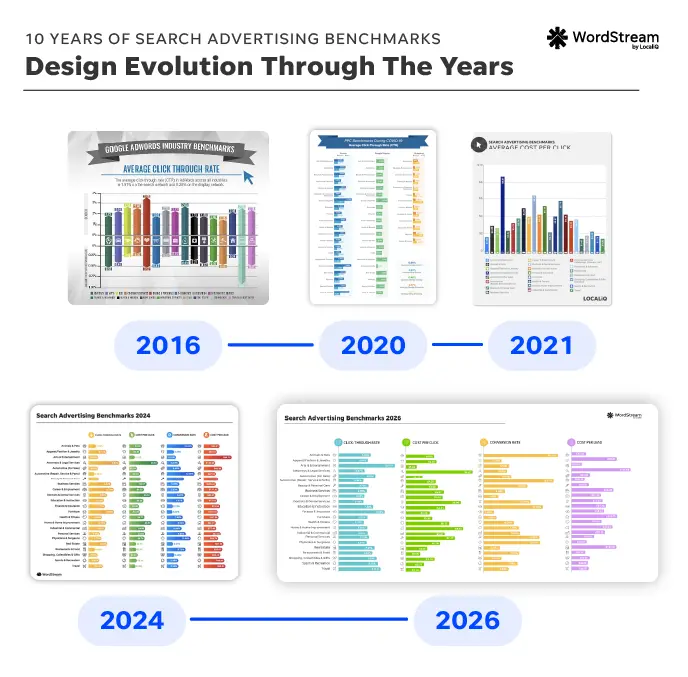
However, the numbers we would reference back when our benchmarks were just taking off look a lot different than the norms on Google Ads now. And, when I say they “look different,” I mean in more ways than one… Check out how our report’s design has evolved!
Here’s a look back at the average search ads performance from our first benchmarks report in 2016:
- Click-through rate: 1.91%
- Cost per click: $2.32
- Conversion rate: 2.70%
- Cost per lead (which we called CPA, or cost per action, back then): $59.18
This data is such a blast from the past! Since then, averages across the board have roughly doubled or tripled.
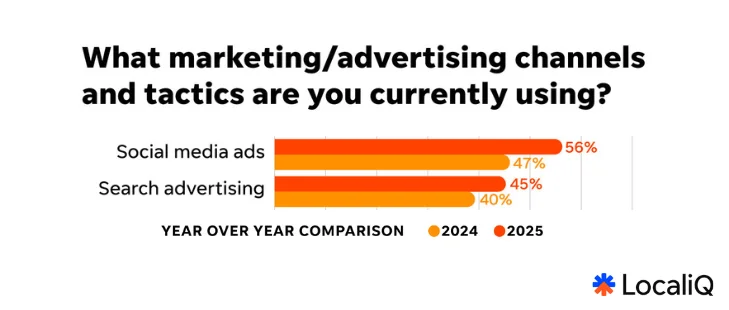
For one, more businesses have gotten into PPC since then, so overall averages have naturally increased as more ads appear on the SERP and competition increases. Now, nearly half of all small businesses we recently surveyed in our small business trends report are using paid search advertising, and that’s been trending upwards year over year.
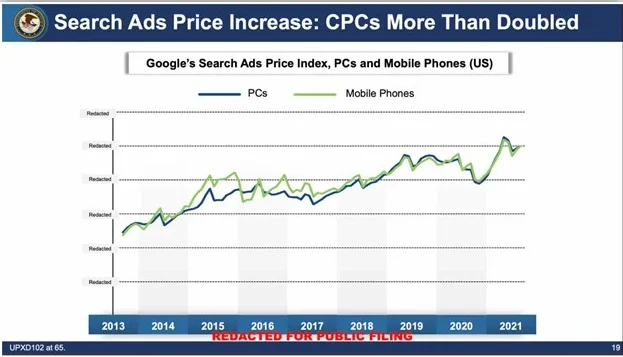
But we have seen other reasons for general increases over the years. For example, we reported in 2024 that Google admitted to having raised search ad prices to meet revenue goals during its antitrust trial.
There are many other factors behind why overall performance averages in Google and Microsoft Ads have fluctuated over the years (does “COVID” ring a bell to anyone?), and that’s why we’ve been so dedicated to consistently running back this report each year. When you’re comparing your current Google Ads account performance to industry averages, we understand that having the most up-to-date information is crucial.
Google Ads Benchmarks 2026: How to take action in your account now
Thinking back on 10 years of Google Ads benchmarks just brings a tear to the eye. We started releasing this data to inform business owners and advertisers with tangible advice that empowers confident account management decisions, and 10 years later, that’s still our MO. With these benchmarks as a guiding light, you can set your business ahead of industry competition and focus on optimizations that make an impact on your account.
For more help making the most of your search ads, see how our solutions can maximize your campaign strategy!
About the data
This report is based on a sample of 13,474 US-based search advertising campaigns running between Apr 1, 2025, and March 31, 2026. Each subcategory includes at minimum 52 unique active campaigns. “Averages” are technically median figures to account for outliers. All currency values are posted in USD.