

The Google Ads platform is (and always has been) built on having lots of data available to advertisers. Whether it’s the number of clicks and conversions or the amount of revenue attributed to your campaigns, there’s always been a wealth of data to work with.
The biggest challenge is knowing how to get to said data available in Google Ads and what to do with it. I want to run through some of the reports I use the most in Google Ads and talk about the takeaways I usually have so you can start making similar optimizations in your accounts.
Contents
- Search terms report
- Ad asset reports
- Auction insights report
- Segment performance breakdowns
- Placement reports
- Custom report editor
6 Google Ads reports every advertiser should know how to use
If you want better insights into your business’s advertising, check out these six Google Ads reports.
1. Search terms report
Search campaigns are the foundation of my experience in Google Ads and continue to be a large part of the digital strategies I leverage for clients.
While those campaigns are founded on keywords, there’s a big difference between those and the actual query someone types into Google.
Keyword match types used to be pretty specific, with exact actually working like the definition of the word. But with the many, many changes to Google’s algorithm over the last few years, along with the increased prevalence of broad match, you could be showing up for phrases that are less and less relevant to your keywords than they used to be. That’s where the search terms report comes in.

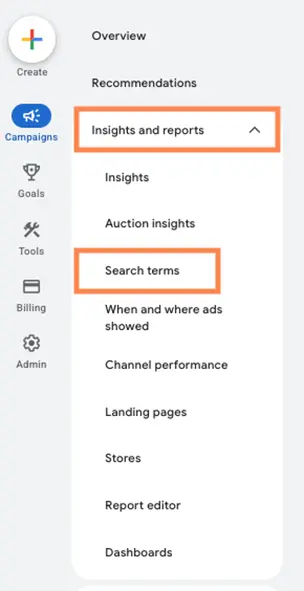
Located in the insights and reports section under search terms in the account, this report shows the queries users typed in to trigger your ad. This way, you can see what those phrases are and compare them to your actual keywords easily by having the keyword column added.
Action items for the search terms report
1. Discover negative keywords: If you find search terms, phrases, or individual words in this report that don’t align with your business, you should add them as a negative keyword to save ad spend. There are many ways to add negative keywords, and the match types work differently for them than regular keywords.
2. Add new keywords: On the flip side, this report can also uncover new keyword themes that you actually want to go after. For those terms, you can either add them directly from the search terms report or you can make a list and upload them manually later. Just be sure to pay attention to the match type you add them to and keep your account structure in mind.
3. Create a regular cadence of reviews: Search term reviews are not a one-time project. This needs to be an ongoing review to ensure you’re always reaching the right users and not wasting money. For new accounts, campaigns, or keywords, I usually try to do this review every couple of days to every week, depending on volume. After those initial guardrails are put in place, you can likely bump this back to every 2 weeks, every month, or, in some cases with low-volume accounts, once every couple of months will suffice.
🚨 Not liking what you see in your Google Ads reports? Clean up your account with our free guide to the perfect Google Ads account structure!
2. Ad asset reports
This is a newer addition to Google Ads’ reporting lineup. In 2025, Google started showing advertisers which individual headlines and descriptions perform as part of Responsive Search Ads. Before that time, we had to rely solely on which RSA variant performed best, but depending on your settings, that could have been any combination of up to 15 headlines and four descriptions. We were in the dark as to what was actually performing.
But now, we have so many more insights. Since this is pretty new (data only goes back to June of 2025) and based on the way we ran ad tests before, I currently take an aggregate look at how messaging has been performing in my accounts.
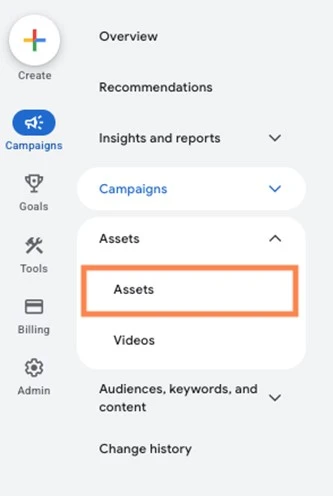
To find that data in your account, head to the assets tab in Google Ads.
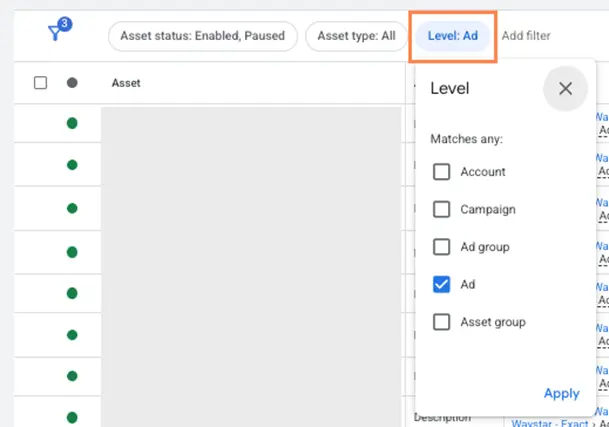
Change the level filter to “ad.”
Then filter the asset type for headlines and descriptions. (Or just one if you prefer to look at them individually.)
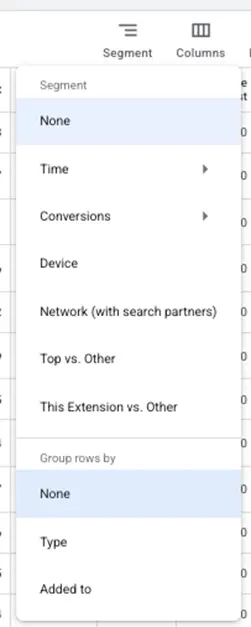
Lastly, for my preferences at least, I like to change the segment to “group rows by” “none.” This way, the report can be more easily ordered in ascending or descending patterns without being limited by which assets are aligned with which campaigns, ad groups, etc.
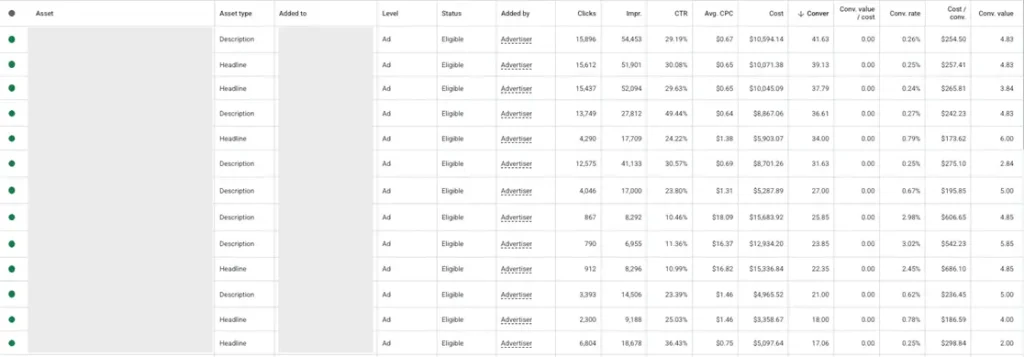
Now your report will look something like the following. All headlines and descriptions for your RSAs will now show not only the impression data, but also clicks, conversions, ROAS, and more.
Action items for the ad assets report
1. Identify top-performing assets: In the past, I’ve always put together themes for my clients’ RSAs to find which messaging works the best. But sometimes, a mix of those options is really what resonates. I’ve begun putting together a “top variants” RSA for any new test that leverages all of the previous top-performing headlines and descriptions, then running those against new themes we’ve developed. Time will tell if the legacy winners will continue winning or if we’ve found a new thread to pull on.
2. Identify lower-performing assets: Obviously, we want to know what works best for ad messaging, but it’s also important to identify what doesn’t work and make note of it so you can either change your approach or avoid that message in the future. Find the lowest performing variants and write them down somewhere you’ll see them when you’re writing your next round of ads, so you can avoid the same mistake twice.
3. Share insights with clients/leadership/content teams: The whole point of this post is to show you the data available in Google Ads. For clients, leadership, and content teams, this type of hard data around messaging can be a goldmine. Ideally, take this raw data and simplify it a little with high-level takeaways so you can inform everyone on what’s working and what’s not, so those insights can be leveraged in other portions of the business.
⚡ Want a clear look at your business’s Google Ads performance? Start with a free, instant account grade using our Google Ads Grader!
3. Auction insights report
The auction insights report gives you a glimpse into who else is showing up in the SERPs alongside your ads. Most commonly, these are going to be your competitors, and this report can give you some good insights into how you stack up.
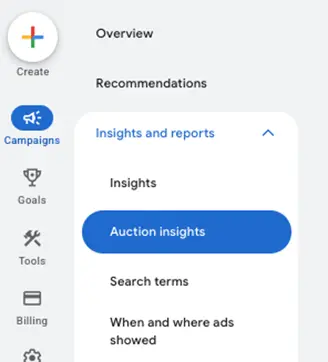
You can find the auction insights report under insights and reports in the campaigns navigation.
The default report will look something like the screenshot below. Each of these columns is designed to give you a different piece of information. The Display URL domain tells you the actual website that was showing ads, then impression share tells you how often you were shown (when eligible) and how often the competitor was shown (when eligible).
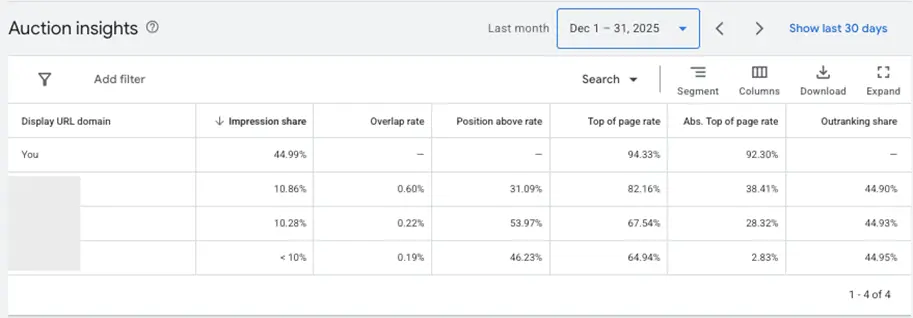
All of the other columns can give you more insights, but my favorites are the overlap rate (how often you and that competitor were shown for the same search) and position above rate (how often the competitor showed in a higher ad position than you). These can tell you how closely aligned your targets are with the competitor and how well you stack up.
Action items for the auction insights report
1. Review multiple aspects of your account: While it might seem like an account-level view would show you all of your competitor information, it actually doesn’t. This report is best leveraged when you review campaigns individually and for multiple different time frames (last seven days, last 30 days, last six months). Each of these will likely show you a different combination of competitors that you can monitor and use for other analyses.
2. Review trending performance: The standard view of the auction insights report shows a snapshot of aggregate data for the time frame you’re viewing. But if you click on segment to the right just above the data table, then hover over time, you can choose to see the data on a daily, weekly, monthly, etc. timeframe. This can show you if competitors are coming or going and how you two are moving over a period of time. Bonus points for taking this report out of the Google Ads interface and creating some simple line charts to get a better visual.
3. Spot check competitors for validation: I like to regularly check the auction insights report to see if the folks who are showing up alongside my ads are actually my competitors or not. This could tell me, for one, that they’re wasting money if I’m confident in my terms. Or secondly, I’m wasting money if I’m not confident in my terms, and multiple domains are promoting something else. Lastly, I can understand who and what I’m up against business-wise, to ensure my keywords and ad copy are compelling and could entice a user to click on my ads rather than the competitor’s.
4. Segment performance breakdowns
This next “report” isn’t totally a report so much as a place to see different segments of performance. It’s available throughout the account within all sorts of different reports and views, and, quite frankly, it’s a function that I use almost as much as everything else in the Google Ads interface combined.
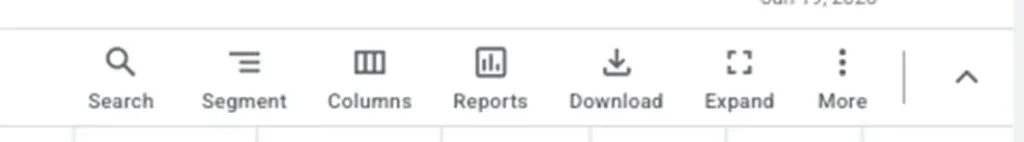
The function itself is called segment, and if it’s compatible with the view you’re looking at, it usually shows up in the toolbar in the upper right-hand side with three lines and the word segment.
For most of the tabs in the Google Ads interface, you’ll see a list of segment options that looks about like this.
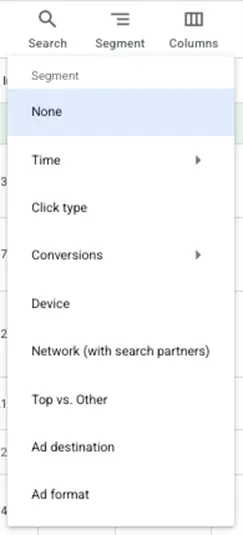
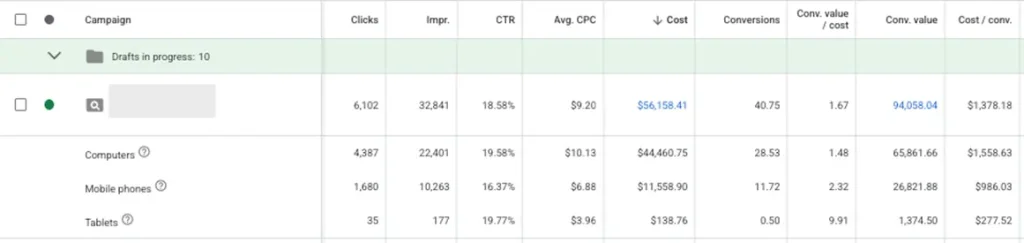
If I select the device, this is what the report looks like, and this is how data will be displayed for all different segments. Each will have its own line item under the campaign, ad group, etc., that you’re looking to review data for that’s broken out by that segment. So here, I can see how computers are performing compared to mobile devices for this campaign.
Each of these options is pretty self-explanatory, and a couple of them have additional dropdowns. For example, the time segment lets you choose day, week, month, quarter, or year (with some limitations) so you can see how your campaign performance has been trending.
Action items for segments
1. Test them all: My best advice for anyone trying to get better at PPC is always to just click around and see what things do. (While also knowing what buttons not to push, like “delete account” or “increase by budget 10,000%.”) Take a look at what each of these segments does and think about how that could help you better investigate performance.
2. Look for anomalous performance: When performance in my campaigns starts to deviate too far from the norm, I like to use segments to try to figure out what’s going on. Is there a spike in Search Partner performance? Did one of our conversion actions suddenly stop generating sales? Segments can help me identify a problem or rule out a series of potential issues before I go digging further into the account.
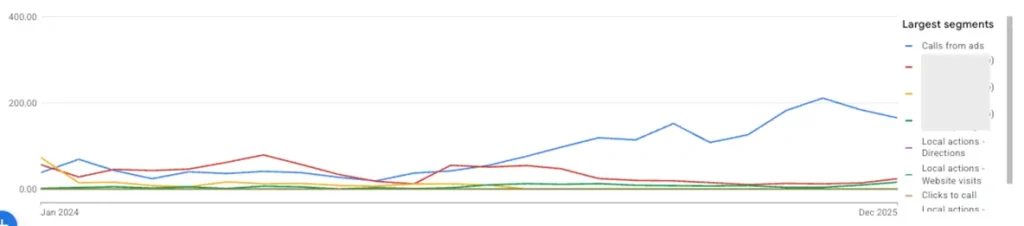
3. Look for trends to lean in to/out of: On a larger scale, if you’re seeing sustained performance changes in your account, you may use segments to identify what type of trend you’re seeing over time so you can identify how long it’s been happening. In the image below, we charted the change in conversion action types over time to discover that we were generating quite a bit more calls than we had before. Halfway through 2025, we decided to continue to lean into this, but without segments, it would have been tough to easily pinpoint that the change in account performance overall could be attributed to such a large increase in calls.
5. Placement reports
While you might not realize it, most campaign types in Google Ads (by default) run on sites that are not owned and operated by Google. While that might sound strange, it’s not always a bad thing. You can definitely see results from these non-Google placements, but they can also be a hotbed for poor performance and low-quality sites. Enter the placement reports.
I say “reports,” plural, because depending on the campaign type you’re using, you’ll have to find this information in different places. Here are the three key options to know:
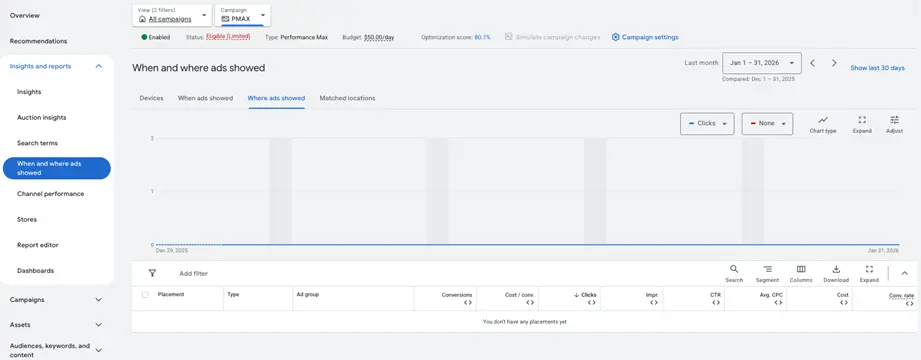
Where ads showed
This is the original source of information for placements your ads can show and will give details on performance for placements in display, YouTube, and Demand Gen campaigns.
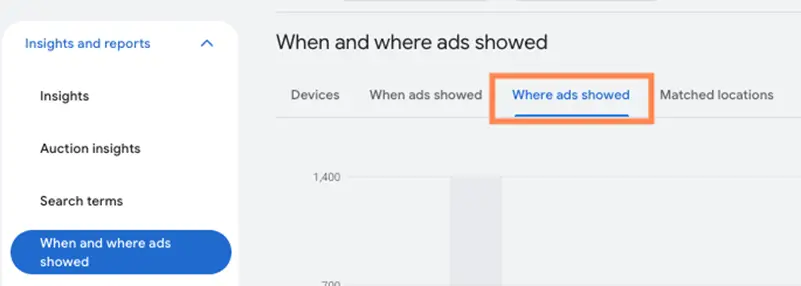
This report can be found in the Insights and reports section, then under when and where ads showed. Lastly, you have to click on the where ads showed tab above the table.
The benefit of this report is that you can view all performance columns that you can see for other aspects of your account. So while this report won’t show all placement types (we’ll get to those next), it does give more insights than others.
Performance Max placement report
If you’re running Performance Max campaigns, you might think you can see those placements in the where ads showed report from above.
Sadly, you’d be mistaken. For whatever reason, Google puts the data for Performance Max campaigns in a separate report.
For that, you’ll have to head to the report editor, then click Performance Max campaigns placement to see that data.
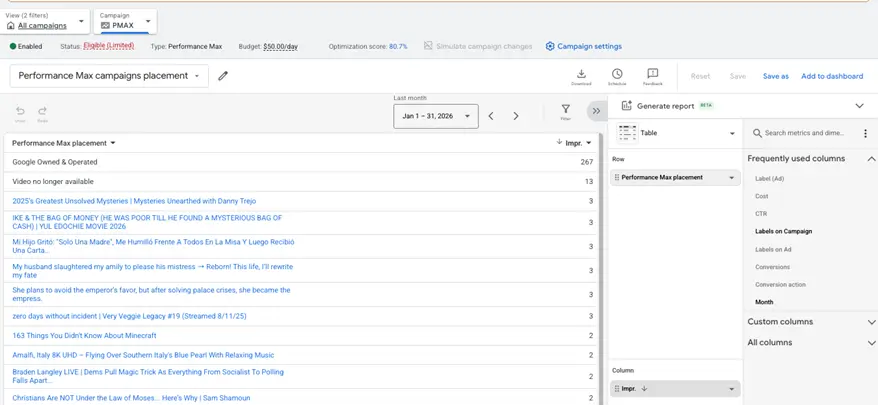
For this report, we’re only able to see the impression count for each placement. No additional data is available, but this is better than nothing!
Search Network placement report
The last types of placements you can use are the newest to Google Ads and are useful if you’re running search campaigns opted into the Search Network.
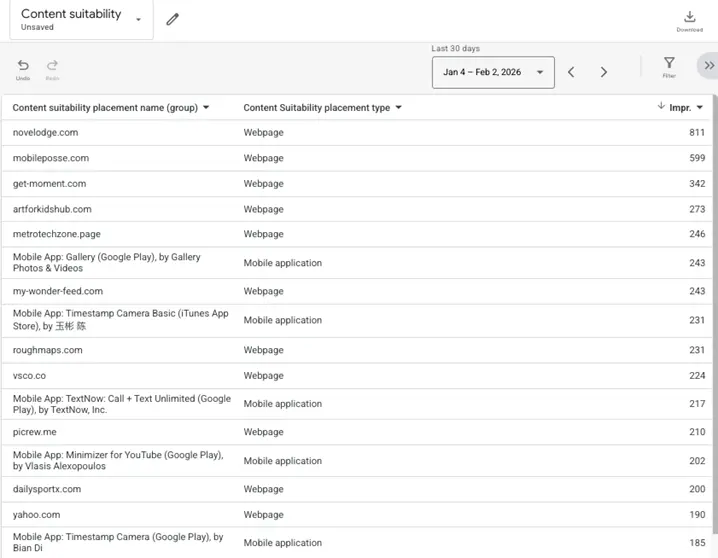
In the report editor, you can navigate to content suitability.
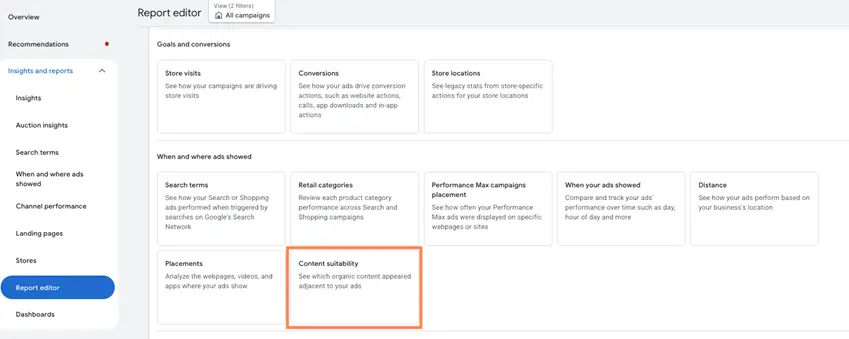
This report also only shows impressions, but it will show the URLs of the Search Partner Network placements your campaigns are showing for. This is a big step for Google, as this network used to be a black box.
Action items for placement reports
1. Exclude low-quality or poor-performance placements: Where possible (meaning, depending on your campaign type), I encourage you to add exclusions for placements that don’t meet your brand suitability or that have low performance. Those are really the only two criteria I use for placement exclusion because, while it may be tempting to go in and exclude every site that doesn’t seem relevant to your brand, it can be an insurmountable undertaking. Plus, if you’re using any sort of automated learning in Google Ads (which you almost always are), putting too many restrictions can sometimes be a hindrance and encourage lower performance.
2. Investigate performance volatility: This is mostly for the Search Partner Network, but if you start to see an influx of crappy traffic or low-quality leads, check to see if there’s been a surge in an individual placement within the network. Odds are, someone went crazy on AdSense, but you can easily fix that with a quick exclusion.
3. Review regularly: Just like everything else in PPC, reviewing placements isn’t a one-and-done task. This should be something you review on a bi-weekly, monthly, or quarterly cadence, depending on how much volume and volatility you have.
6. Custom report editor
While I certainly haven’t covered all of the reports available in Google Ads, there is one place you can go to get nearly any information you need out of the platform: the report editor.
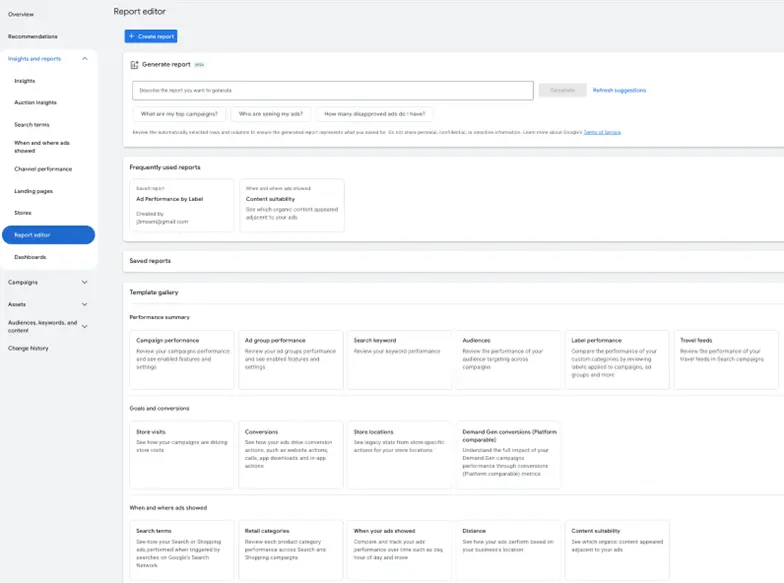
We already talked about the content suitability and Performance Max Placement Reports that live in this area, but there are loads of other templates you can use and customize to gain more information from your campaigns.
There’s even an option to make a completely blank report from scratch so you can combine the different segments and data points you want to see. Just note: some metrics and breakdowns aren’t compatible with each other, so you might get stuck on some investigations.
Keep an eye on all the Google Ads reports you can
The Google Ads platform has a wealth of information about your campaigns and how they’re performing. It’s up to you to figure out what you want to see and be able to know where to look to find it.
Hopefully, this has given some insights into the types of stats I usually monitor in my accounts, but as I mentioned, the report editor can be your best friend if you’re not finding what you need in a premade report. For more ways to analyze and maximize your Google Ads reports, see how our solutions can help.