

You’ve probably seen some version of these three claims:
- Quote-led headlines outperform plain declarative ones by nearly 29%.
- Question headlines underperform both, sometimes by 24%.
- Format drives the result: Rewrite a statement as a quote, or add that magic word, and you should expect a real lift.
We tested all three against 1,674,518 English editorial articles and 1,690,295 French articles from the 1492.vision Discover corpus (November 2025 to May 2026): about 3.4 million editorial articles with at least one capture across our fleet.
They share a deeper flaw than any of their numbers.
All three treat headline format as a cause — a lever you pull to gain visibility. But the data shows, layer after layer, that a format’s measured effect is almost entirely a proxy for something else: which publisher used it, for which audience, and on which Discover surface.
The headline is a symptom of those choices, not an independent driver.
The clearest demonstration is Simpson’s paradox. Once you see it, you find it throughout the dataset.
A note on what we measure
Our metric isn’t clicks from Discover; no third party has that data. It’s hits per article: how often an article appears across the 1492.vision fleet we observe, a proxy for visibility.
The corpus is limited to editorial articles. YouTube and X are excluded because their headlines follow different conventions. We’ll return to both at the end—they sharpen the point more than anything else.
A word on why the volume matters: the entire argument depends on being able to slice 3.4 million articles by publisher, Discover surface, topic, and language while still retaining enough data in each segment for meaningful comparisons. That’s the difference between a number and an insight — and between a real format effect and a statistical mirage.
The number is real, at the wrong altitude
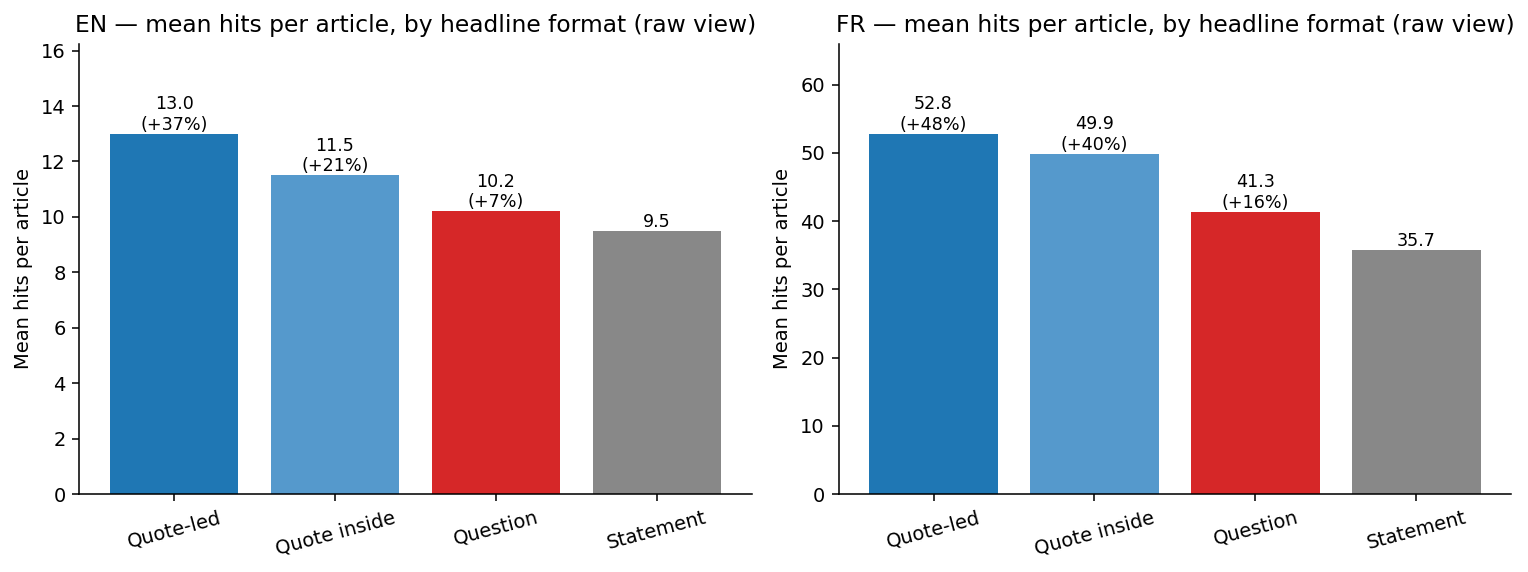
Pool all publishers together, and a clean gradient emerges: quote-led headlines at the top, statements at the bottom.
| Lang | Format | Articles | Mean hits | Median | vs statement |
|---|---|---|---|---|---|
| EN | Quote-led | 38,044 | 13.0 | 4 | +37% |
| EN | Quote inside | 75,463 | 11.5 | 4 | +21% |
| EN | Question | 53,081 | 10.2 | 4 | +7% |
| EN | Statement | 1,674,518 | 9.5 | 3 | baseline |
| FR | Quote-led | 179,472 | 52.8 | 13 | +48% |
| FR | Quote inside | 223,052 | 49.9 | 12 | +40% |
| FR | Question | 103,117 | 41.3 | 11 | +16% |
| FR | Statement | 1,690,295 | 35.7 | 9 | baseline |
The commonly cited +29% is conservative for pure editorial articles: quote-led headlines show a +37% lift in English and +48% in French. Questions, far from underperforming, also outperform statements (+7% EN, +16% FR).
At this level of aggregation, claim 1 looks understated and claim 2 looks plainly wrong.
This is the level of aggregation where most headline advice is born. Hold onto that +37% figure — the rest of this piece is about what it’s actually measuring.
Hidden variable 1: which publisher
The aggregate can’t answer a crucial objection on its own: the publishers that use quotes aren’t the same publishers that don’t.
Celebrity media, regional dailies, and buzz-driven sites lean heavily on quotes and earn more Discover hits per article regardless of headline format. Pure-play publishers, wire services, and utility-focused sites favor declarative headlines and tend to sit lower.
The raw comparison, then, isn’t quote versus statement. It’s one publisher population versus another.
This is a textbook Simpson’s paradox: a strong trend in the aggregate that weakens, disappears, or reverses once you segment by group.
To get anywhere near the effect of headline format itself, the grouping variable has to be the publisher.
So make each publisher its own baseline: compare quote versus statement within the same site, holding audience and topic mix constant.
Across 324 English and 439 French publishers with enough of both formats — at least 50 quote and 200 statement articles each:

| Lang | Publishers | Quote wins (median site) | Quote wins (mean site) | Median within-publisher Δ |
|---|---|---|---|---|
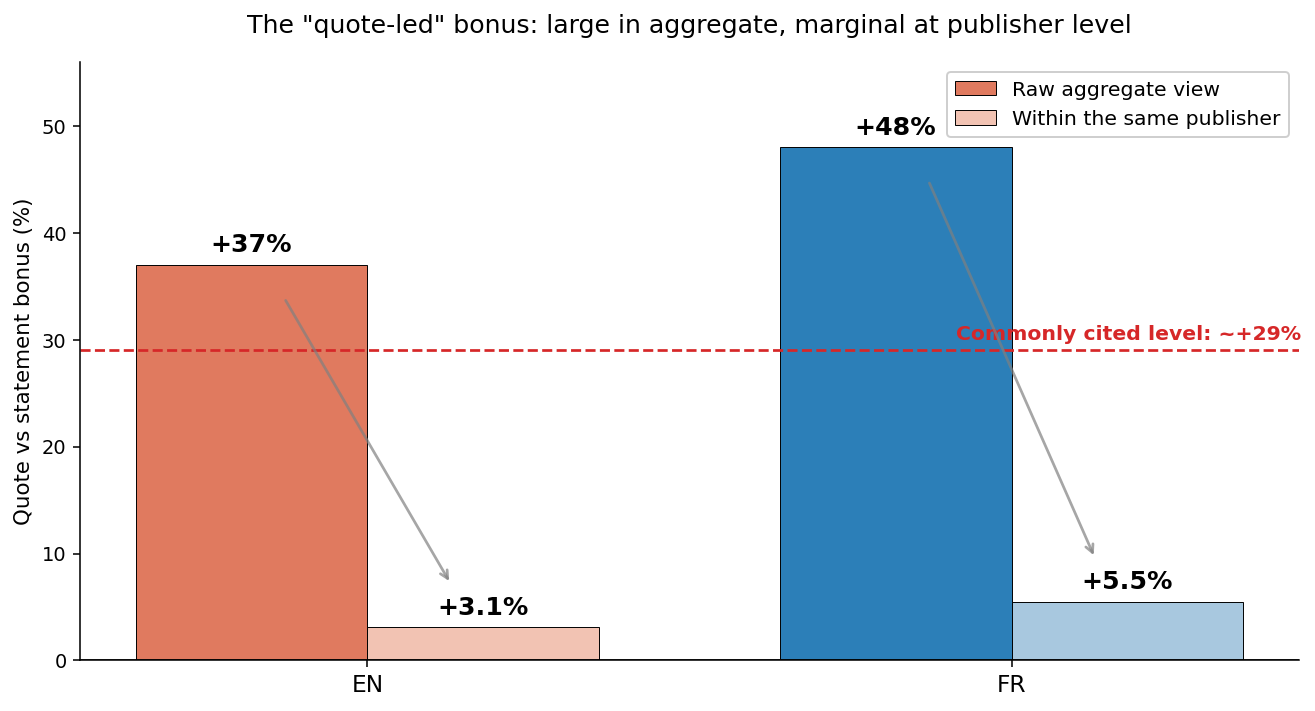
| EN | 324 | 31.5% | 55.9% | +3.1% |
| FR | 439 | 47.6% | 57.4% | +5.5% |
In English, statements outperform quotes at 68% of publishers by the median; quote-led headlines hurt more often than they help. In French, the result is close to a coin flip.
That leaves the underlying format effect at roughly +3% to +5%—about five to nine times smaller than the aggregate figure.
(The mean is higher than the median because a minority of publishers see large gains from quotes. The median is the more reliable measure of the typical publisher.)
Stop here and the lesson sounds like “segment your data.” But the collapse points to something larger.
If three-quarters of a +37% effect was really a publisher effect, the obvious next question is: what else is the headline metric standing in for?
The rest of this article is a tour of those hidden variables. And by this point, the answer to claim 3 is already coming into view: the format itself isn’t the driver.
The same substitution, in reverse: questions

The conventional advice says questions underperform by roughly 24%. The aggregate view of our data says the opposite: questions outperform statements (+7% EN, +16% FR).
Both conclusions are wrong for the same reason. Question headlines are disproportionately used by high-engagement publishers, which inflates their aggregate performance.
Within publishers, the picture settles.
In English, question headlines show a modest real underperformance (-3.7%), winning at only 29.3% of sites. In French, the effect is essentially neutral (-0.5%), with questions outperforming at 46.2% of sites.
The conventional advice gets the direction roughly right in English and neutral in French, but its usual magnitude is about sixfold too large.
The question mark isn’t the cause. The kind of publisher using it is. Same hidden variable, opposite sign.
The effect won’t even hold still

Even that modest within-publisher effect drifts from month to month.
In English, it peaks at +2.5% and turns negative in March 2026, while statements outperform questions at 55% to 60% of sites each month. In French, it ranges from +3% to +12% — strongest in December and February, weakest in March — with no clear trend.
A genuine causal lever shouldn’t wobble like this. A correlation tied to a shifting content mix should.
Hidden variable 2: Which audience

The +3-5% average hides a sharp, consistent split. In English:
- Gainers: International general news (BBC +85%, Forbes +46%, CBS News +43%, Boston Globe), Yahoo aggregators, mass-market magazines (Parade, Good Housekeeping), Gizmodo.
- Losers: Specialist sport (RugbyPass, Planet F1, ThisIsAnfield), entertainment (IMDb, TVInsider, People), and factual-leaning dailies (Standard, Washington Post).

French data follows the same pattern in a different market.
- Gainers: Regional newspapers (La Dépêche, La Montagne, L’Écho Républicain) and general-interest magazines (Grazia).
- Losers: Specialist sports outlets (Foot National, le10sport, MadeInFoot), technology publishers (Les Numériques), and service-oriented titles (Journal des Femmes, Femme Actuelle).
The pattern is editorial, not algorithmic. Quotes tend to work where the audience comes for commentary, reaction, and framing, and fail where the audience comes for facts.
A publisher built around “what someone said” benefits from a quoted headline. One built around “what just happened” usually doesn’t.
The convergence between English and French is the giveaway. This isn’t a language effect; it’s a reader-intent effect.
What looks like a headline-format effect is, in this case, an audience effect wearing the clothes of a headline.
Hidden variable 3: Which Discover surface
Discover isn’t a single feed. It’s a collection of pipelines, each selecting articles in different ways:
- Editorial curation (
moonstone,mustntmiss). - The main topic-personalization engine (
aura). - Related-reading context (
paginationpanoptic,content). - Similarity-based recommendation (
relatedcontentruby,userpersonascontent).
First, rule out the obvious alternative explanation. Are quote-led articles simply being routed to higher-value Discover surfaces, making the apparent bonus a placement effect rather than a headline effect?
The data says no.
Comparing where quote and statement articles actually appear, the distributions are nearly identical. In English, the largest differences are small: content.f (+2.2 percentage points), aura.f (-1.9), and moonstone.f (+0.6).
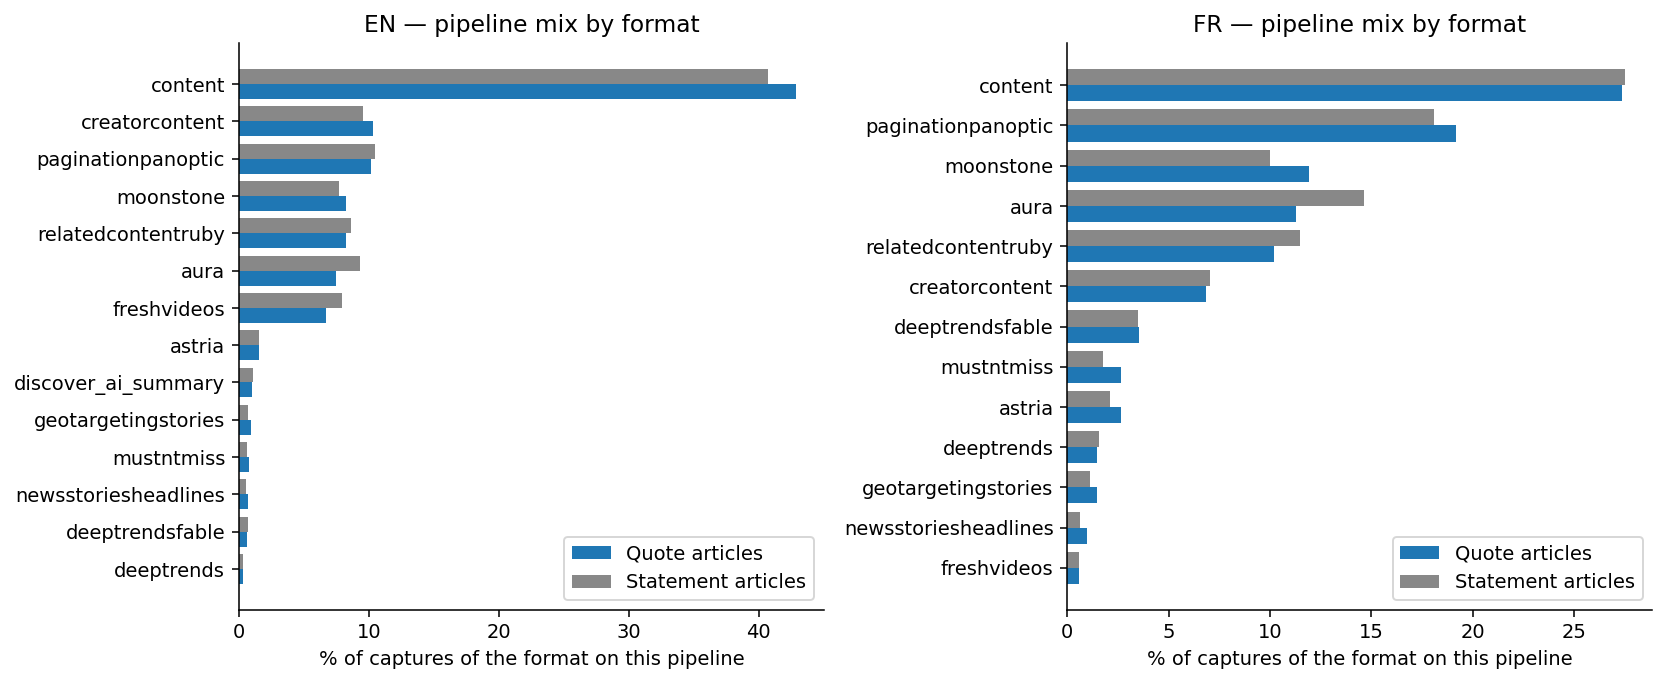
The bonus isn’t about placement: quotes and statements appear on the same surfaces in the same proportions. It’s about intensity — how each format performs once it’s on a surface. There, the overall +3% to 5% breaks into a wide range: from +22% to -14% in EN and from +25% to -12% in FR.

Grouped into functional families, the pattern is readable:
| Pipeline family | EN | FR |
|---|---|---|
| Editorial curation (moonstone, mustntmiss, astria, news…) | +3.4% | +9.7% |
| Related reading / context (paginationpanoptic, content…) | +2.0% | +6.7% |
| Trends / freshness (deeptrends, freshvideos…) | +4.4% | +2.3% |
Main personalization (aura) |
+0.6% | +1.8% |
| Similarity-based recommendation (relatedcontentruby, userpersonas…) | -1.6% | -1.9% |
Quote-led headlines win where multiple headlines compete for attention at once — curation carousels, news clusters, and other surfaces where the title carries a social signal: someone said this. They lose on similarity-based recommendations, where the surface sells continuity (“because you read X, you’ll read Y”) and a quote disrupts the topic-clear promise with an out-of-context citation.
The largest pipeline by volume, Aura, ranks on topic affinity and barely reacts to format at all, with gains of just +0.6% to +1.8%.
Why is the net effect so small?
A single quote-led FR article doesn’t get one number; it gets a blend:
- +10 to +25% on its curation share (moonstone, mustntmiss, astria)
- ~0% on its aura share, the largest slice of volume
- -3% on its relatedcontentruby share (≈ 10% of captures)
- -2 to -6% on shopping/viewer-related surfaces
Integrate those and you land at +4% to +7% net. The curatorial gains are real but partly offset by recommendation losses, which is why the aggregate is nowhere near +29%. The same format is both an asset and a liability, depending entirely on the surface serving it.
And +4–7% overstates how much the format itself matters because each pipeline’s ranking is a compound of signals unrelated to the title: engagement, scroll depth, topic affinity, E-E-A-T, entities, reading history, location, timing, and prior interactions.
A quote in the headline is, at best, one weak signal competing with all of those. Long before an article reaches a feed, it’s largely swamped by everything else.
Questions by pipeline, same story sharper

These are within-publisher medians (each publisher against itself), so they aren’t a crude artifact of FR using more questions. The format follows the same pipeline logic as quotes, but in a more polarized form:
- FR curation leans positive on questions; EN curation leans negative.
astria.f, the same pipeline in both languages, runs +9% in FR and -1% in EN; FRmustntmiss.fis +14%, ENmoonstone.fis -13%. - Similarity-based recommendation penalizes questions everywhere, harder than quotes:
relatedcontentruby.fFR -11.5% (306 publishers), EN -6.1% (119);itemitemcollaborativefiltering.fFR -14.5%. aurastays neutral in both (+3.5% FR, -0.6% EN).
Two caveats point in the same direction:
- A fleet-capture metric can’t distinguish an algorithmic penalty from an audience-eviction effect: readers see a question mark, decide “not now,” and scroll past. The fact that relatedcontentruby — which serves already-engaged readers — penalizes questions this heavily points to a behavioral signal, not just ranking.
- Within-publisher pairing controls for each publisher against itself, but the median is still computed across a different set of publishers in FR and EN, on partly different surfaces. So “FR rewards questions, EN doesn’t” describes the publishers and topics occupying each cell, not an inherent property of the language or the question mark. It’s another hidden variable mistaken for a format effect.
Hidden variable 4: Which editor, and which judgment
Even the honest +3% to 5% comes with a caveat that outweighs its size. When a publisher writes a headline as a quote, they choose the best available quote for that story. So the within-publisher figure compares the best quote an editor selected with the average of all that publisher’s statements, not the same article written two ways.
It’s the subject-line A/B testing problem: a good alternative beats a bad one, but the average alternative doesn’t. Convert every headline to quote-led and you’d be writing average quotes, so most of the gain would disappear. The +3–5% is an upper bound on a selective practice, not the return from a blanket rule.
That’s the final reason “do it everywhere” fails:
- Not every article has a quote. A sports result, a press release, a market analysis, a product test: forcing one means fabricating it.
- The editor-selection bias above: The measured bonus is the best quote chosen, not a property of the format.
- Recommendation pipelines are long-tail levers.
relatedcontentrubyand friends are how an article redeploys after its initial peak, the main mechanism for extending Discover lifetime. Optimizing the headline for the curation peak while breaking the promise on these surfaces can net negative. - The largest pipeline barely reacts.
aurais 11% to 15% of FR captures and 7% to 9% of EN, with a +0.6% to 1.8% quote effect. A universal quote rule optimizes secondary surfaces while ignoring that the biggest one runs on topic affinity.
The clincher: the same format, opposite meaning

We excluded YouTube and X from the main corpus, but their results are the clearest proof of the thesis. The same quote-led format produces opposite effects depending entirely on what the title is trying to do.
| Domain | Lang | Quote articles | Statement | Mean hits quote | Mean hits stmt | Δ |
|---|---|---|---|---|---|---|
| YouTube | EN | 43,476 | 734,986 | 11.6 | 10.2 | +14% |
| YouTube | FR | 16,509 | 93,912 | 59.0 | 29.1 | +103% |
| x.com | EN | 34,156 | 268,175 | 5.2 | 4.9 | +6% |
| x.com | FR | 32,201 | 114,914 | 21.4 | 24.6 | -13% |
On YouTube, the title is effectively a text thumbnail that has seconds to create curiosity. A quote serves as a content promise — “here’s the line worth hearing” — which helps explain the +103% result in French. On X, the title is the post itself, and a detected quote usually indicates that someone is repeating or responding to another person’s words, diluting the original message. That correlates with a -13% result.
Same characters. Same regex. Opposite outcome. The format didn’t change; the job it was doing did.
(Methodological footnote: a naive audit that folded YouTube into the editorial corpus would inflate the overall quote bonus by 20–30 points, while one that folded in X would dilute it. Any serious headline study has to isolate editorial articles before measuring headline effects.)
The headline was never the variable
Put the layers together. Three-quarters of the +37% raw bonus was explained by publisher differences. What remained split again by audience, then by Discover surface, then by which quote the editor selected, and finally reversed entirely when the title served a different function on another platform. At every step, removing context shrank or flipped the apparent format effect.
There’s no clean residue at the bottom where the headline acts independently. The effect is inseparable from the context that creates it.
That’s not a measurement failure; it’s the finding. We just saw the mechanism. Headline format is one weak signal among many stronger ones, all moving through pipelines that often pull in opposite directions.
The consequence is the point. An article’s visibility is the running score of that entire contest, not the verdict of any headline rule. A number measured across publishers is downstream of everything that travels with the format: who published it, what topic it covers, what the audience expects, the newsroom’s style and habits, and the conventions of the language itself.
So when an aggregate reports “+29% for quotes,” it isn’t isolating the quotation marks. It’s measuring a correlation with that whole bundle of factors and quietly relabeling it as causation.
None of this means aggregate data is the enemy. Everything above comes from aggregate data, just analyzed at the right level.
The trap is narrower: treating a single cosmetic variable, averaged across publishers that don’t belong in the same category, as a causal lever.
The same index that exposes that mistake also reveals the signals that genuinely drive Discover: which topics a publisher wins on, which entities are accelerating, who dominates a given surface, and what’s trending before it peaks. Those signals aren’t cosmetic, and they aren’t drowned out by stronger forces. They’re the underlying demand that headline format only weakly approximates.
The lesson isn’t “ignore the data.” It’s “stop averaging the wrong variable across the wrong population.”
This is why no cross-publisher average, corrected or not, converts into a rule for your site:
- Visibility isn’t traffic. Two sites can earn identical Discover visibility on the same article and see very different CTRs because their audiences click for different reasons.
- No two audiences are the same. A quote that reads as insider commentary to a magazine reader may read as vague or irrelevant to someone scanning sports scores.
- A cross-publisher average of one cosmetic feature is the average of audiences you don’t have. Segment by your audience, your topics, and your surfaces, and it becomes information again.
The only test that answers your question is the one you run on your own site, with your own audience. Know who you’re writing for, then measure them. Slice the data by your audience, your topics, and your surfaces — not by a single number averaged across everyone.
So what about the three claims?
Each is real as a correlation and useless as a cause:
- “Quotes beat statements by ~29%”: True in aggregate — larger than +29%, in fact — but mostly explained by publisher differences. At the publisher level, the residue is +3% to 5%, and even that compares the best quote an editor selected against the average of all statements, not the format itself.
- “Questions underperform”: Directionally true in EN, neutral in FR, but the magnitude is about 6x too large. The actual effect is roughly -4% in EN and ~0% in FR.
- “The format itself is the driver”: The claim the dataset refutes. The same article from the same publisher, mechanically rewritten as a quote, would not gain the aggregate effect.
The honest version, if you want one sentence to keep:
A quote-led headline can earn roughly +3% to 7% additional Discover visibility for audiences that value commentary and framing (general news, magazines, regional press), especially on curation surfaces, and lose for factual audiences (sports, tech, utility) and on similarity-based recommendation surfaces. There is no universal gain from quotation marks; the popular ~+29% figure overstates the format effect by roughly an order of magnitude. The useful question isn’t “Should I use a quote?” but “Who am I writing for, and which Discover surface drives my traffic?” The only place to answer that is with your own site, not anyone else’s average.
Methodology
- Data and period: 1,674,518 EN and 1,690,295 FR editorial articles with Discover visibility from 1492.vision proprietary data, collected between 2025-11-01 and 2026-05-19. Editorial articles only; excludes ads, videos, AI Overviews, and showcases. Domain exclusions: x.com, twitter.com, m.twitter.com, youtube.com, www.youtube.com, and m.youtube.com (reported separately above).
- Headline format detection (regex): Quote-led: title starts with a multi-word quoted phrase (“…”, «…», ‘…’, or ‘X…’:). Quote inside: a quoted phrase appears but not at the start. Question: ends with ?. Statement: everything else. Titles under 20 or over 300 characters are excluded. Detection deliberately errs toward false negatives in the quote bucket, biasing against finding a quote effect, so the +3–5% is conservative.
- Three layers of analysis: (1) Raw aggregate: all publishers pooled, producing +37% / +48%. (2) Within-publisher: quote vs. statement inside each publisher with ≥50 quote and ≥200 statement articles; we report the share of publishers favoring quotes and the median per-publisher Δ. This neutralizes publisher-mix bias. (3) Monthly evolution: the same pairing, recomputed monthly with relaxed thresholds (≥10 quote, ≥40 statement).
- Pipeline layer: Captures come from 1492.vision proprietary data, with each row representing one capture on a specific pipeline. For each (pipeline, format, publisher), captures per article = pipeline captures ÷ distinct articles. Within-publisher pairing includes publishers with ≥20 quote (or question) and ≥60 statement articles on that pipeline. A pipeline is shown only if ≥5 publishers qualify. Pipeline families are an empirical grouping (editorial curation, related reading, trends, similarity-based recommendation, and main personalization) that reflects how each surface behaves.
- Metric: A “hit” is one capture of an article on Discover by the 1492.vision device fleet. It is a visibility proxy, not a visit.
- Known limitations: (1) No traffic data: the metric is Discover visibility, not clicks, so a format could affect CTR independently without appearing here. (2) Regex detection misses edge cases and is biased toward under-counting quotes. (3) Within-publisher effects compare the best quote an editor selected against the average statement, not the counterfactual of making every headline quote-led. (4) Some negative pipelines have small publisher samples (<10); the consistent direction matters more than any individual magnitude.
Contributing authors are invited to create content for Search Engine Land and are chosen for their expertise and contribution to the search community. Our contributors work under the oversight of the editorial staff and contributions are checked for quality and relevance to our readers. Search Engine Land is owned by Semrush. Contributor was not asked to make any direct or indirect mentions of Semrush. The opinions they express are their own.